TLDR: Bitcoin trades at $113,449, down 2.52% in 24h, with $40.1B daily volume, per CoinGecko. Short-term holders accumulated Bitcoin above $107K, increasing exposure to deeper losses if price breaks down. Analysts warn $107K breach could trigger heavy liquidations across multiple exchanges from leveraged long positions. Strong support seen near $111K–$112K, but failure to hold could [...] The post Bitcoin Price Analysis: Why Experts Warn BTC Could Drop Below $107K appeared first on Blockonomi.TLDR: Bitcoin trades at $113,449, down 2.52% in 24h, with $40.1B daily volume, per CoinGecko. Short-term holders accumulated Bitcoin above $107K, increasing exposure to deeper losses if price breaks down. Analysts warn $107K breach could trigger heavy liquidations across multiple exchanges from leveraged long positions. Strong support seen near $111K–$112K, but failure to hold could [...] The post Bitcoin Price Analysis: Why Experts Warn BTC Could Drop Below $107K appeared first on Blockonomi.

Bitcoin Price Analysis: Why Experts Warn BTC Could Drop Below $107K

3 min read

TLDR:

  • Bitcoin trades at $113,449, down 2.52% in 24h, with $40.1B daily volume, per CoinGecko.
  • Short-term holders accumulated Bitcoin above $107K, increasing exposure to deeper losses if price breaks down.
  • Analysts warn $107K breach could trigger heavy liquidations across multiple exchanges from leveraged long positions.
  • Strong support seen near $111K–$112K, but failure to hold could deepen market pessimism into late August.

Bitcoin’s price is sliding into a dangerous zone. Traders are watching closely as leveraged positions build and short-term holders take risks. Market sentiment has weakened in recent days, setting the stage for volatile swings. 

Analysts warn that a key level near $107K could decide the next move. A sharp break lower could trigger fresh waves of liquidations.

Short-Term Bitcoin Holders Push Risk Higher

Data shared by Alphractal showed that short-term holders have been buying Bitcoin at elevated prices this cycle. 

Their realized price now stands above $107,000, a level described as critical for avoiding deeper losses. Unlike previous cycles, these investors entered late and heavily leveraged, especially on long trades.

This behavior has expanded their exposure to downside pressure. A fall below the $107K mark would put them underwater with little margin to recover

Analysts argue that liquidation pools are stacked below this point across several exchanges. Such conditions make the market fragile and prone to sudden downside spikes.

Alphractal described the recent push to $124K as a bull trap designed to capture liquidity. Traders who chased the move higher are now facing mounting losses as the price retreats. The data suggests many may not withstand further downside pressure if support fails.

BTC Support Levels and Liquidation Pressure

Chart analysis from Dr Cat pointed to a cluster of strong support between $110,688 and $112,076. 

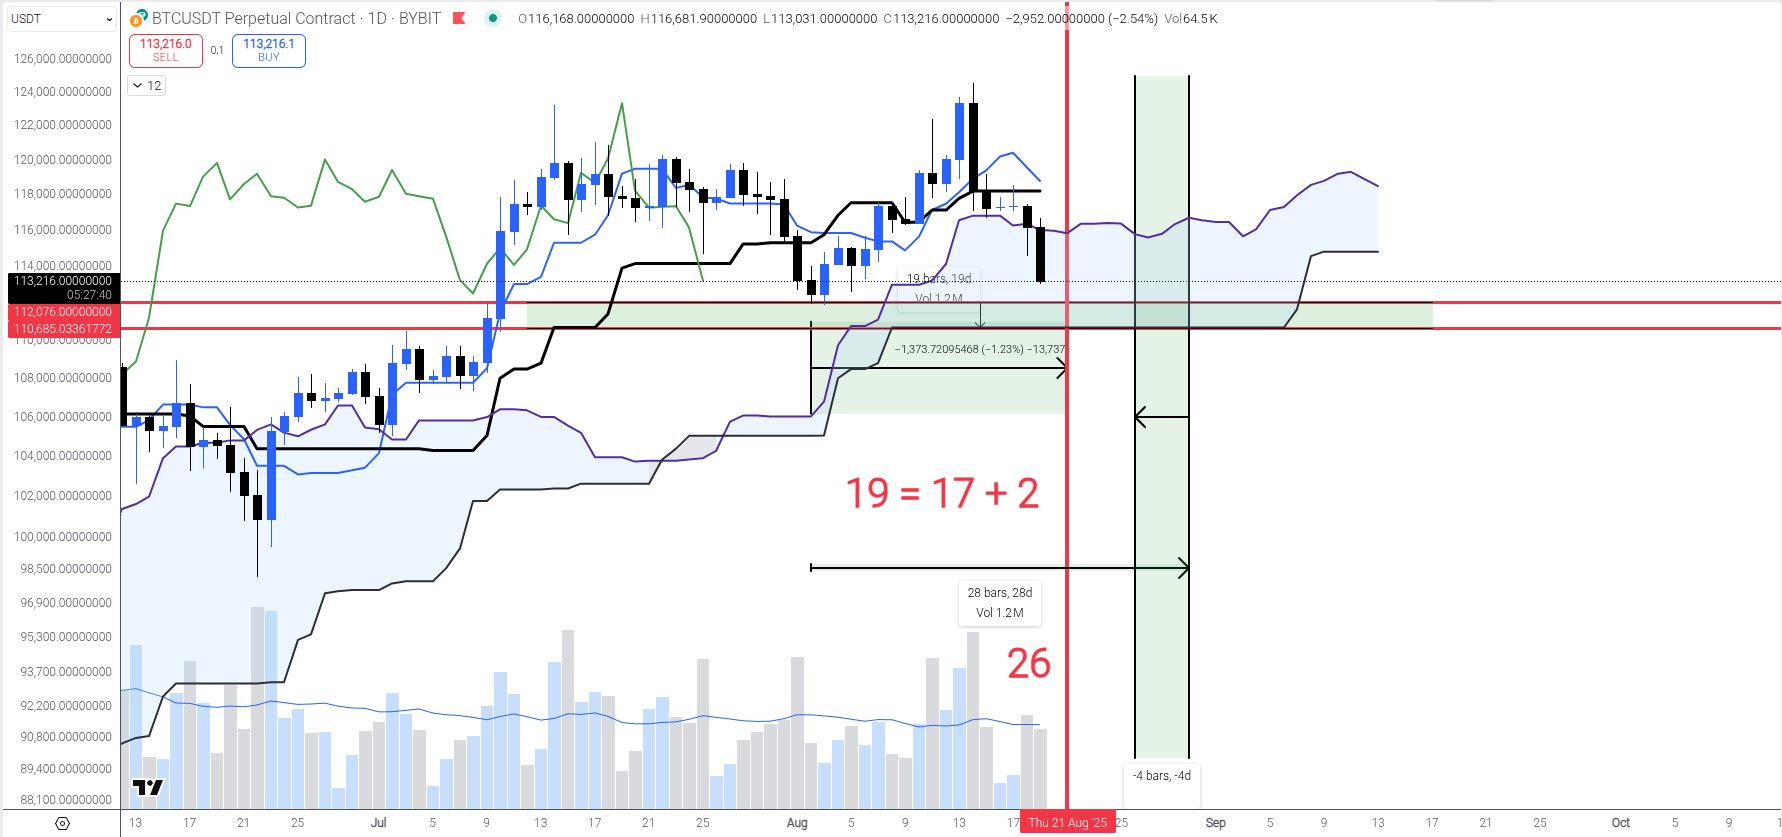
Key technical lines such as the daily SSB and the three-day Kijun Sen fall in this range. According to his outlook, Bitcoin needs to retest this zone quickly to form a possible local bottom.

If that move happens before August 21, or later between August 26 and 30, traders could reassess the setup. But the timing is critical. A delayed or deeper breakdown may weaken confidence in broader technical structures.

At the same time, TheKingfisher reported that nearly 78.5% of liquidation levels are concentrated on the short side. This imbalance creates a tug-of-war between bearish sentiment and liquidity grabs by larger players.

Price could swing sharply in either direction as leverage builds.

CoinGecko data at press time showed Bitcoin trading at $113,449 with $40.1 billion in 24-hour volume. The price has dropped 2.52% in the past day and nearly 5% over the past week. Traders now wait to see if support around $111K holds, or if the feared $107K test comes next.

The post Bitcoin Price Analysis: Why Experts Warn BTC Could Drop Below $107K appeared first on Blockonomi.

Market Opportunity
NEAR Logo
NEAR Price(NEAR)
$1.145
$1.145$1.145
-0.17%
USD
NEAR (NEAR) Live Price Chart
Disclaimer: The articles reposted on this site are sourced from public platforms and are provided for informational purposes only. They do not necessarily reflect the views of MEXC. All rights remain with the original authors. If you believe any content infringes on third-party rights, please contact service@support.mexc.com for removal. MEXC makes no guarantees regarding the accuracy, completeness, or timeliness of the content and is not responsible for any actions taken based on the information provided. The content does not constitute financial, legal, or other professional advice, nor should it be considered a recommendation or endorsement by MEXC.

You May Also Like

Securities Fraud Investigation Into Corcept Therapeutics Incorporated (CORT) Announced – Shareholders Who Lost Money Urged To Contact Glancy Prongay Wolke & Rotter LLP, a Leading Securities Fraud Law Firm

Securities Fraud Investigation Into Corcept Therapeutics Incorporated (CORT) Announced – Shareholders Who Lost Money Urged To Contact Glancy Prongay Wolke & Rotter LLP, a Leading Securities Fraud Law Firm

LOS ANGELES–(BUSINESS WIRE)–Glancy Prongay Wolke & Rotter LLP, a leading national shareholder rights law firm, today announced that it has commenced an investigation
Share
AI Journal2026/02/05 04:00
Microsoft Corp. $MSFT blue box area offers a buying opportunity

Microsoft Corp. $MSFT blue box area offers a buying opportunity

The post Microsoft Corp. $MSFT blue box area offers a buying opportunity appeared on BitcoinEthereumNews.com. In today’s article, we’ll examine the recent performance of Microsoft Corp. ($MSFT) through the lens of Elliott Wave Theory. We’ll review how the rally from the April 07, 2025 low unfolded as a 5-wave impulse followed by a 3-swing correction (ABC) and discuss our forecast for the next move. Let’s dive into the structure and expectations for this stock. Five wave impulse structure + ABC + WXY correction $MSFT 8H Elliott Wave chart 9.04.2025 In the 8-hour Elliott Wave count from Sep 04, 2025, we saw that $MSFT completed a 5-wave impulsive cycle at red III. As expected, this initial wave prompted a pullback. We anticipated this pullback to unfold in 3 swings and find buyers in the equal legs area between $497.02 and $471.06 This setup aligns with a typical Elliott Wave correction pattern (ABC), in which the market pauses briefly before resuming its primary trend. $MSFT 8H Elliott Wave chart 7.14.2025 The update, 10 days later, shows the stock finding support from the equal legs area as predicted allowing traders to get risk free. The stock is expected to bounce towards 525 – 532 before deciding if the bounce is a connector or the next leg higher. A break into new ATHs will confirm the latter and can see it trade higher towards 570 – 593 area. Until then, traders should get risk free and protect their capital in case of a WXY double correction. Conclusion In conclusion, our Elliott Wave analysis of Microsoft Corp. ($MSFT) suggested that it remains supported against April 07, 2025 lows and bounce from the blue box area. In the meantime, keep an eye out for any corrective pullbacks that may offer entry opportunities. By applying Elliott Wave Theory, traders can better anticipate the structure of upcoming moves and enhance risk management in volatile markets. Source: https://www.fxstreet.com/news/microsoft-corp-msft-blue-box-area-offers-a-buying-opportunity-202509171323
Share
BitcoinEthereumNews2025/09/18 03:50
Over 80% of 135 Ethereum L2s record below 1 user operation per second

Over 80% of 135 Ethereum L2s record below 1 user operation per second

The post Over 80% of 135 Ethereum L2s record below 1 user operation per second  appeared on BitcoinEthereumNews.com. Ethereum’s L2s are not doing too well. Data
Share
BitcoinEthereumNews2026/02/05 03:52