

Galaxy Analyst Warns Bitcoin Could Drop to $63K Due to Ownership Gap
Galaxy Digital’s Head of Research, Alex Thorn, has issued a stark warning that Bitcoin could fall another 19% to the $63,000 level, citing a significant gap in onchain ownership between $82,000 and $70,000.
The warning comes as Bitcoin already trades over 38% below its October 6, 2025, all-time high of $126,298.
Thorn’s analysis reveals that the current price structure lacks meaningful demand between $70,000 and $80,000, creating a vacuum that could accelerate selling pressure in the near term.
The report paints a picture of a market still grappling with deep structural weakness despite bullish narratives.
The $70K-$80K Ownership Gap Spells Trouble
According to Galaxy Research’s Bitcoin supply data based on when coins last moved onchain, a clear gap in ownership is visible in the $70,000-$80,000 range.
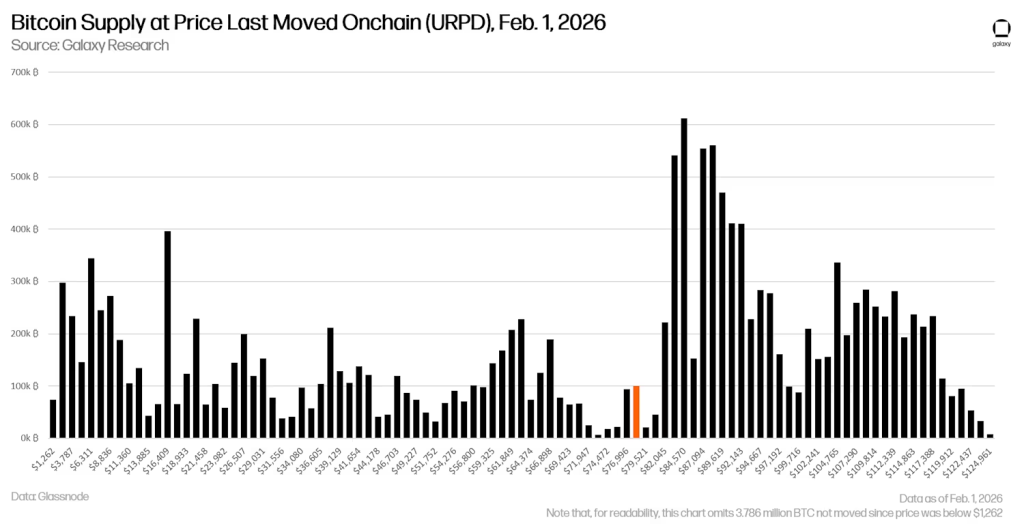 Source: Galaxy Research
The vast majority of the approximately 194,000 BTC shown to have last traded between $77,000 and $79,500 and did so just within the last two days, meaning these are shallow positions unlikely to hold under pressure.
Significant purchases have been made between $80,000 and $92,000 over the last four months, but all other price cohorts have contributed to selling pressure.
 Source: Galaxy Research
“While it could see chop around the historic max discount-to-ETF-cost-basis of -10% (currently around $76k), for the reasons above, there is a significant chance that BTC drifts towards the bottom of the supply gap ($70k) and then potentially tests the realized price ($56k) and 200-week moving average ($58k) over the coming weeks and months,” Thorn explained.
Historical Patterns Signal Deeper Pain Ahead
With the exception of 2017, Bitcoin has never experienced a 40% drawdown from its all-time high that didn’t extend to 50% or more within three months.
A 50% drawdown from the current all-time high would place BTC at exactly $63,000, the level Thorn flags as the next major pain point.
Data from Galaxy Research shows that across the last three bull markets in 2013/14, 2017/18, 2019, and 2021, the 50-week moving average served as key support.
Source: Galaxy Research
However, when that level was lost, the price ultimately reverted to the 200-week moving average each time.
Bitcoin lost the 50-week moving average in November 2025, and the 200-week moving average currently sits at $58,000.
The realized price, measuring the average cost basis for coins based on their last onchain movements, currently sits around $56,000, presenting another critical support zone to watch.
Gold Outperforms as Bitcoin Struggles With Narrative
Since the beginning of Q4 2025, Bitcoin has failed to keep pace with traditional safe-haven assets like gold and silver, a trend that has not gone unnoticed by financial commentators.
Investors have been fleeing toward commodities amid escalating trade tensions and growing concerns over the sustainability of global sovereign debt.
Source: TradingView
Bitcoin was widely expected to benefit from these conditions, given its decentralized nature and borderless utility.
Yet the leading cryptocurrency has moved in the opposite direction, surrendering ground to established hard assets and losing credibility among investors seeking refuge from macroeconomic turbulence.
Where Could BTC Bottom Hold?
Galaxy Research flagged at the tail end of last year that 2026 would likely prove too unpredictable to pin down a year-end price target for BTC.
Forty-five days into the year, that assessment has only proven more accurate.
Despite the bleak near-term outlook, the investment firm sees a potential opportunity emerging at lower levels.
Thorn noted that Bitcoin has historically found support around or slightly below the realized price before trading higher at past bear-market bottoms.
Source: Galaxy Research
If price falls toward the 200-week moving average at $58,000 or the realized price at $56,000, Galaxy Research believes these levels should present strong entry points for long-term investors, consistent with patterns seen in previous cycles.
You May Also Like

Over 60% of crypto press releases linked to high-risk or scam projects: Report

ArtGis Finance Partners with MetaXR to Expand its DeFi Offerings in the Metaverse
