The post BTC Price Enters a Reset Phase After $74,500 Crash Shakes Market Structure appeared first on Coinpedia Fintech News BTC price fell sharply to $74,500 overThe post BTC Price Enters a Reset Phase After $74,500 Crash Shakes Market Structure appeared first on Coinpedia Fintech News BTC price fell sharply to $74,500 over

BTC Price Enters a Reset Phase After $74,500 Crash Shakes Market Structure

3 min read
Why is Bitcoin Dropping? Bitcoin Falls to $79K as Crypto Market Bleeds

The post BTC Price Enters a Reset Phase After $74,500 Crash Shakes Market Structure appeared first on Coinpedia Fintech News

BTC price fell sharply to $74,500 over the weekend following a sudden escalation in geopolitical tensions and a sharp rally in the US dollar. The violent move was cruelly responsible for erasing billions in market value, triggering forced liquidations and exposing fragile leverage across crypto markets as risk appetite abruptly vanished.

BTC Price Breakdown Fueled by a Liquidity Shock

The weekend sell-off marked one of the most aggressive downside moves in recent months and as experts hoped for a positive Q1 2026 it didn’t went as planned. As thin liquidity conditions amplified volatility as Bitcoin became a source of immediate liquidity rather than a defensive asset. Contrary to safe-haven expectations, BTC price USD moved in tandem with risk assets like ETH, XRP, and others as traders rushed to reduce exposure.

At the same time, President Donald Trump’s anger over the current Fed chair, Jerome Powell, led to the nomination of Kevin Warsh to the Federal Reserve, which further strengthened the dollar. This surge cruelly pressured traditional hedges as well, with gold and silver experiencing sharp declines post news. In light of this news, automated sell orders cascaded across crypto assets, accelerating the downside.

From a BTC price chart perspective, the speed of the drop suggested forced selling rather than discretionary exits, with leveraged long positions bearing the brunt of the move.

Retail Distribution vs Whale Accumulation

Beyond price action, on-chain data presents a more complex picture. Santiment metrics indicate that retail wallets holding fewer than 1,000 BTC were responsible for the crash as they have been steadily reducing exposure for over a month. This persistent selling aligns with fear-driven behavior often observed during sharp drawdowns.

Meanwhile, larger holders tell a different story. Wallets holding between 1,000 and 10,000 BTC have continued accumulating during the decline. This divergence suggests that while sentiment among smaller participants has deteriorated, but larger investors may be treating the drawdown as a rebalancing phase rather than an exit signal. 

BTC Price Enters a Reset Phase After $74,500 Crash Shakes Market Structure

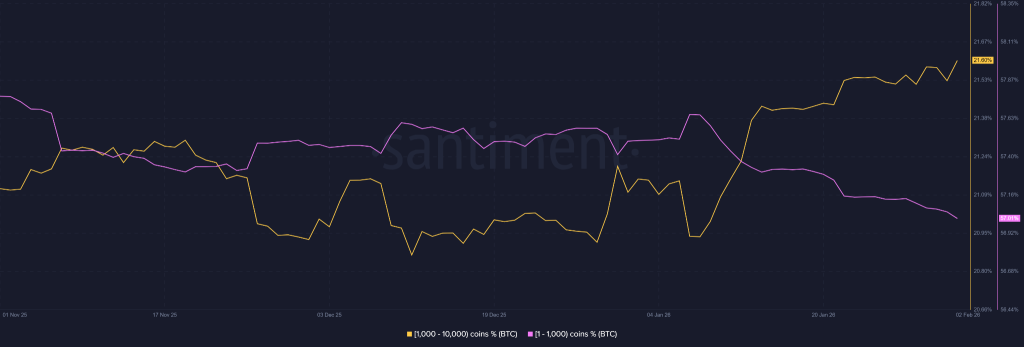
That said, this accumulation has not yet translated into visible price support, highlighting the scale of selling pressure still present from retailers.

Derivatives Market Shows a Forced Reset

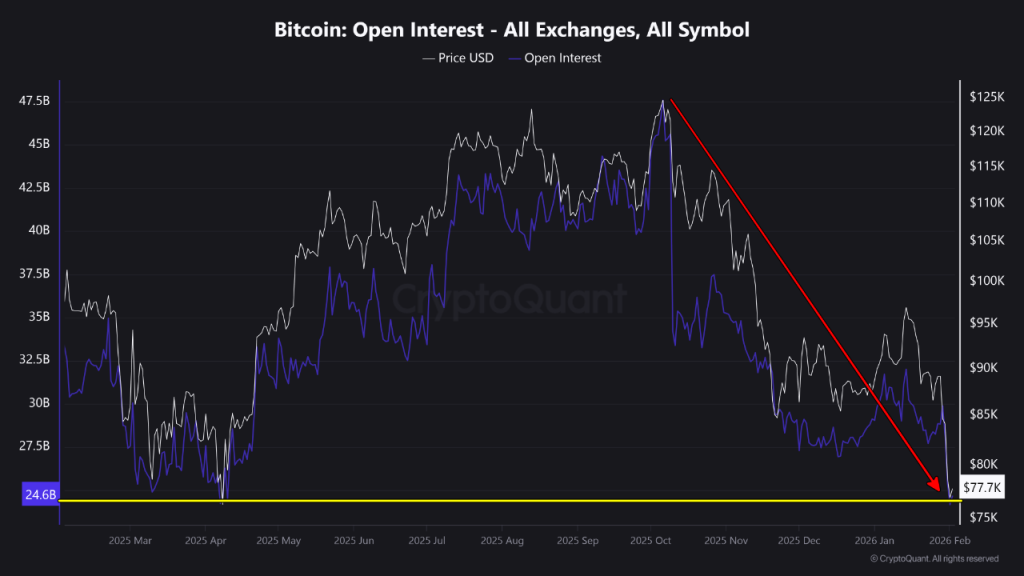
From a derivatives standpoint, the BTC crypto market has undergone a rapid reset. CryptoQuant data shows open interest collapsing from nearly $47.5 billion in late 2025 to roughly $24.6 billion, a drawdown of almost 50%. This signals the near-total removal of speculative leverage that previously supported higher prices.

BTC Price Enters a Reset Phase After $74,500 Crash Shakes Market Structure

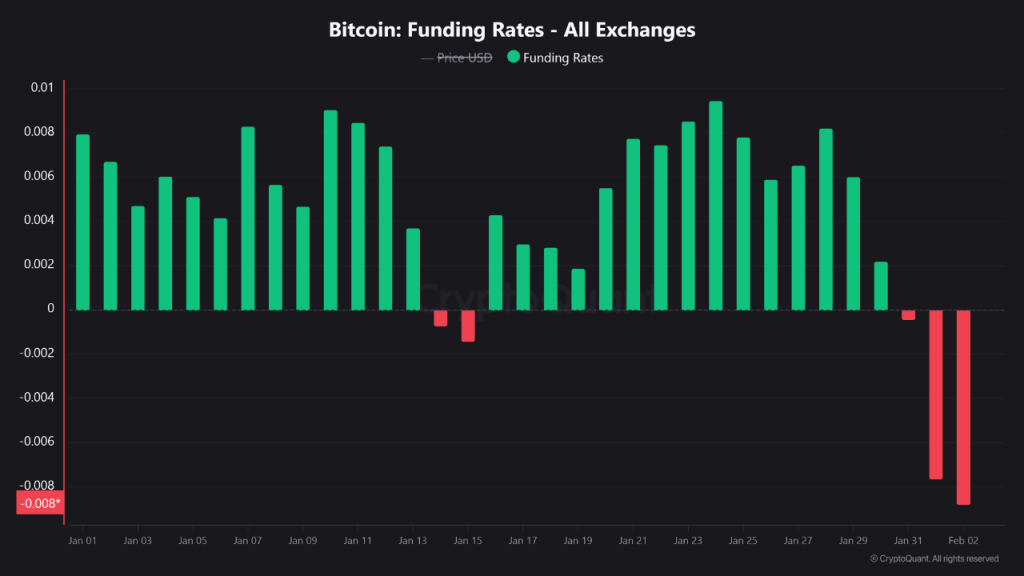
Funding rates further confirm the shift. Rates plunged deep into negative territory, reaching levels not seen since September 2024. A reading near -0.008 reflects aggressive short positioning and the complete loss of short-term bullish control.

BTC Price Enters a Reset Phase After $74,500 Crash Shakes Market Structure

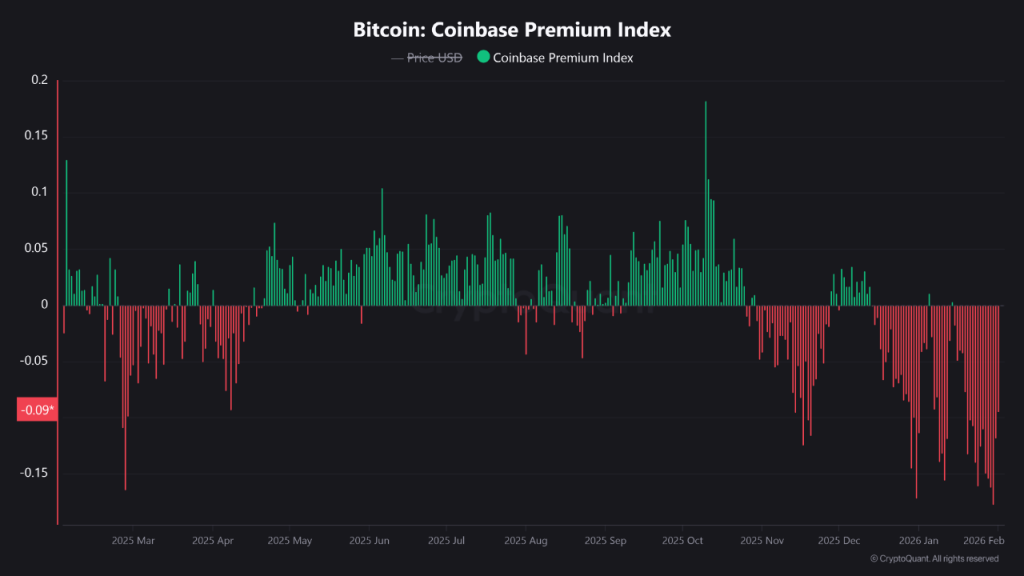
Meanwhile, the Coinbase Premium Index has remained deeply negative. This suggests that US-based institutional and professional traders continue to lead the selling pressure, reinforcing the lack of domestic demand.

BTC Price Enters a Reset Phase After $74,500 Crash Shakes Market Structure

Miner Capitulation Adds Structural Pressure

Still, pressure has not been confined to traders alone. The Bitcoin network has seen an estimated 30% drop in hashrate, pointing to meaningful miner capitulation. Rising miner outflows indicate a transition from holding mined BTC to active liquidation.

BTC Price Enters a Reset Phase After $74,500 Crash Shakes Market Structure

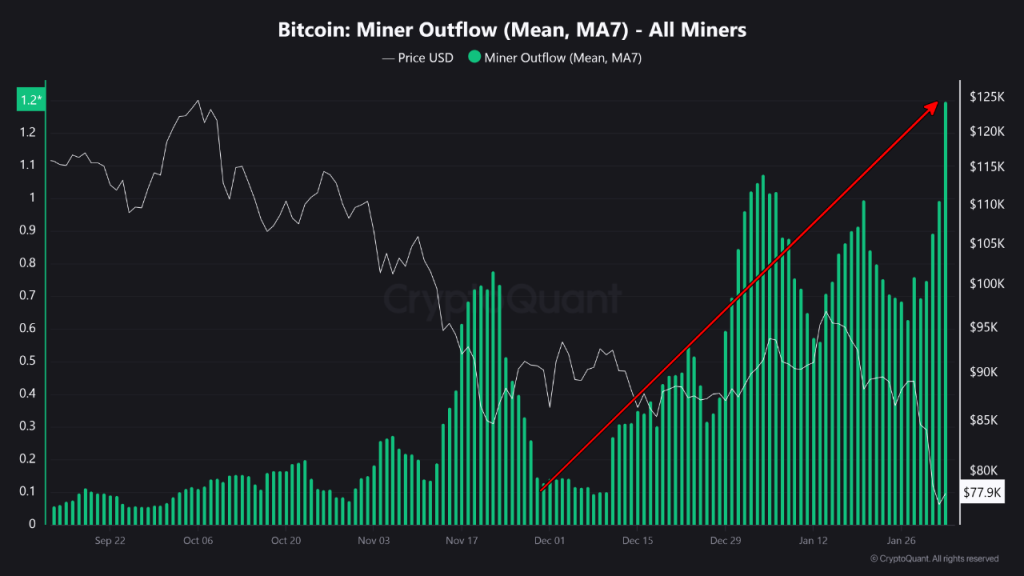
From a structural angle, miner selling typically accompanies periods of margin stress and declining profitability. While painful, these phases often coincide with broader market resets rather than trend continuation.

Disclaimer: The articles reposted on this site are sourced from public platforms and are provided for informational purposes only. They do not necessarily reflect the views of MEXC. All rights remain with the original authors. If you believe any content infringes on third-party rights, please contact service@support.mexc.com for removal. MEXC makes no guarantees regarding the accuracy, completeness, or timeliness of the content and is not responsible for any actions taken based on the information provided. The content does not constitute financial, legal, or other professional advice, nor should it be considered a recommendation or endorsement by MEXC.

You May Also Like

Three dormant wallets, suspected to belong to the same entity, purchased 5,970 ETH eight hours ago.

Three dormant wallets, suspected to belong to the same entity, purchased 5,970 ETH eight hours ago.

PANews reported on February 4 that, according to Lookonchain monitoring, three wallets that had been dormant for four years (likely controlled by the same entity
Share
PANews2026/02/04 11:36
BlackRock Increases U.S. Stock Exposure Amid AI Surge

BlackRock Increases U.S. Stock Exposure Amid AI Surge

The post BlackRock Increases U.S. Stock Exposure Amid AI Surge appeared on BitcoinEthereumNews.com. Key Points: BlackRock significantly increased U.S. stock exposure. AI sector driven gains boost S&P 500 to historic highs. Shift may set a precedent for other major asset managers. BlackRock, the largest asset manager, significantly increased U.S. stock and AI sector exposure, adjusting its $185 billion investment portfolios, according to a recent investment outlook report.. This strategic shift signals strong confidence in U.S. market growth, driven by AI and anticipated Federal Reserve moves, influencing significant fund flows into BlackRock’s ETFs. The reallocation increases U.S. stocks by 2% while reducing holdings in international developed markets. BlackRock’s move reflects confidence in the U.S. stock market’s trajectory, driven by robust earnings and the anticipation of Federal Reserve rate cuts. As a result, billions of dollars have flowed into BlackRock’s ETFs following the portfolio adjustment. “Our increased allocation to U.S. stocks, particularly in the AI sector, is a testament to our confidence in the growth potential of these technologies.” — Larry Fink, CEO, BlackRock The financial markets have responded favorably to this adjustment. The S&P 500 Index recently reached a historic high this year, supported by AI-driven investment enthusiasm. BlackRock’s decision aligns with widespread market speculation on the Federal Reserve’s next moves, further amplifying investor interest and confidence. AI Surge Propels S&P 500 to Historic Highs At no other time in history has the S&P 500 seen such dramatic gains driven by a single sector as the recent surge spurred by AI investments in 2023. Experts suggest that the strategic increase in U.S. stock exposure by BlackRock may set a precedent for other major asset managers. Historically, shifts of this magnitude have influenced broader market behaviors as others follow suit. Market analysts point to the favorable economic environment and technological advancements that are propelling the AI sector’s momentum. The continued growth of AI technologies is…
Share
BitcoinEthereumNews2025/09/18 02:49
NVIDIA Stock Price Analysis as OpenAI Issues Concerns About its Chips

NVIDIA Stock Price Analysis as OpenAI Issues Concerns About its Chips

Key Insights NVIDIA stock started the week in the red. It crashed by over 2%. Meanwhile, the S&P 500, Dow Jones, and Nasdaq 100 moved close to their all-time highs
Share
Themarketperiodical2026/02/04 11:27