With the fear sentiment hanging around the crypto assets, the price movement displays both red and green waves. The broader market awaits a steady upside motionWith the fear sentiment hanging around the crypto assets, the price movement displays both red and green waves. The broader market awaits a steady upside motion

Bearish Winds Hit Pudgy Penguins (PENGU): Is Further Downside Still on the Table?

2026/01/24 15:32
3 min read
  • Pudgy Penguins is trading around $0.01001.
  • PENGU’s daily trading volume is at $118M.

With the fear sentiment hanging around the crypto assets, the price movement displays both red and green waves. The broader market awaits a steady upside motion, which could trigger a rally. The largest asset, Bitcoin, hovers at $89.6K, and Ethereum, the largest altcoin, trades at around $2.9K. 

Meanwhile, Pudgy Penguins (PENGU) is riding on the bears, with a 0.28% spike. The asset’s daily lowest and highest trading ranges fall between $0.009669 and $0.01021. If the brief uptick gains more traction, the bulls could strengthen and take the price toward recent key highs. Whereas, a downside move of PENGU would invite more losses.

As per the reporting of the CoinMarketCap data, at the time of writing, Pudgy Penguins traded within the $0.01001 range, with the market cap reaching $629.48 million. Besides, the 24-hour trading volume of PENGU has soared by over 11.98%, touching the $118.48 million mark. 

PENGU’s current negative trading pattern might trigger its price to slip toward the support at around $0.009961. Upon the bearish correction intensifying, the death cross could emerge, and the bears drive the price to a key zone at $0.009882 or even lower. 

On the upside, assume a reversal with the bullish entry, the Pudgy Penguins price could move up to its resistance near $0.01011. If the bullish pressure is building up the momentum, the golden cross might form, likely sending the asset’s price above $0.01022. 

Momentum Fades for Pudgy Penguins as Technicals Lean Bearish

Pudgy Penguins’ Moving Average Convergence Divergence (MACD) line and the signal line are found below the zero line, which indicates bearish momentum. The short-term price action is weaker than the long-term trend. Unless the lines start moving back above the zero line, the downside pressure may continue.

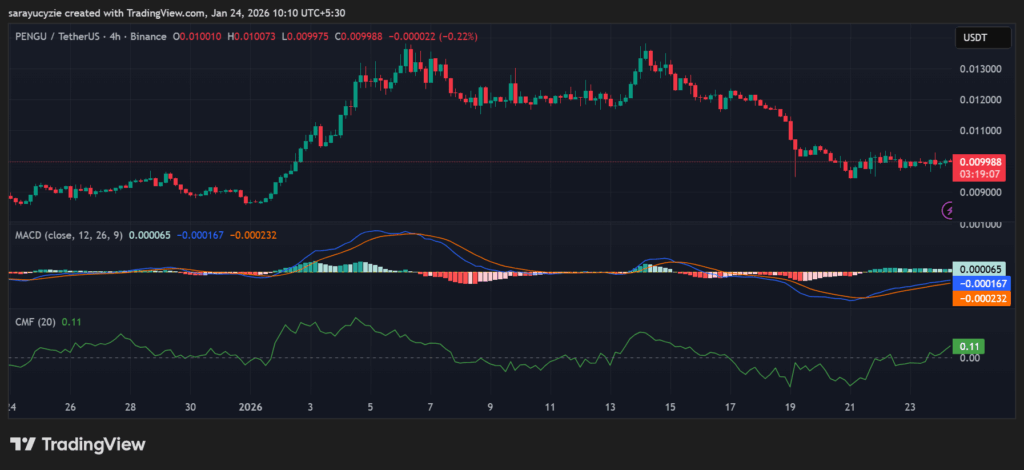
PENGU chart (Source: TradingView)

Moreover, the Chaikin Money Flow (CMF) indicator of PENGU at 0.11 is slightly bullish, with mild buying pressure. More capital is flowing into the asset than out, not very strong, and suggests weak accumulation rather than a decisive bullish move. Also, a sustained value above zero would strengthen the bullish scenario.

The Bull-Bear Power (BBP) reading of Pudgy Penguins is stationed at 0.000084 implies a near-neutral condition, with no strong momentum on either side. The market lacks confidence right now, and a clearer trend may only emerge if this value moves decisively higher or lower. 

Furthermore, PENGU’s daily Relative Strength Index (RSI) staying at 44.34 hints at neutral-to-bearish sentiment. As it is below 50, the sellers have a slight edge. Notably, there is room for further downside or consolidation, and a push back above would shift the momentum bullish.

Top Updated Crypto News

U.S. Spot Dogecoin ETF Activity Remains Weak Even After 21Shares TDOG Launch

Disclaimer: The articles reposted on this site are sourced from public platforms and are provided for informational purposes only. They do not necessarily reflect the views of MEXC. All rights remain with the original authors. If you believe any content infringes on third-party rights, please contact service@support.mexc.com for removal. MEXC makes no guarantees regarding the accuracy, completeness, or timeliness of the content and is not responsible for any actions taken based on the information provided. The content does not constitute financial, legal, or other professional advice, nor should it be considered a recommendation or endorsement by MEXC.

You May Also Like

Microsoft Corp. $MSFT blue box area offers a buying opportunity

Microsoft Corp. $MSFT blue box area offers a buying opportunity

The post Microsoft Corp. $MSFT blue box area offers a buying opportunity appeared on BitcoinEthereumNews.com. In today’s article, we’ll examine the recent performance of Microsoft Corp. ($MSFT) through the lens of Elliott Wave Theory. We’ll review how the rally from the April 07, 2025 low unfolded as a 5-wave impulse followed by a 3-swing correction (ABC) and discuss our forecast for the next move. Let’s dive into the structure and expectations for this stock. Five wave impulse structure + ABC + WXY correction $MSFT 8H Elliott Wave chart 9.04.2025 In the 8-hour Elliott Wave count from Sep 04, 2025, we saw that $MSFT completed a 5-wave impulsive cycle at red III. As expected, this initial wave prompted a pullback. We anticipated this pullback to unfold in 3 swings and find buyers in the equal legs area between $497.02 and $471.06 This setup aligns with a typical Elliott Wave correction pattern (ABC), in which the market pauses briefly before resuming its primary trend. $MSFT 8H Elliott Wave chart 7.14.2025 The update, 10 days later, shows the stock finding support from the equal legs area as predicted allowing traders to get risk free. The stock is expected to bounce towards 525 – 532 before deciding if the bounce is a connector or the next leg higher. A break into new ATHs will confirm the latter and can see it trade higher towards 570 – 593 area. Until then, traders should get risk free and protect their capital in case of a WXY double correction. Conclusion In conclusion, our Elliott Wave analysis of Microsoft Corp. ($MSFT) suggested that it remains supported against April 07, 2025 lows and bounce from the blue box area. In the meantime, keep an eye out for any corrective pullbacks that may offer entry opportunities. By applying Elliott Wave Theory, traders can better anticipate the structure of upcoming moves and enhance risk management in volatile markets. Source: https://www.fxstreet.com/news/microsoft-corp-msft-blue-box-area-offers-a-buying-opportunity-202509171323
Share
BitcoinEthereumNews2025/09/18 03:50
XRP Buyers Defend Most Major 200-Week Price Average: Can It Be Bottom of 2026?

XRP Buyers Defend Most Major 200-Week Price Average: Can It Be Bottom of 2026?

The post XRP Buyers Defend Most Major 200-Week Price Average: Can It Be Bottom of 2026? appeared on BitcoinEthereumNews.com. XRP has returned to its 200-week moving
Share
BitcoinEthereumNews2026/02/08 19:49
Expert Tags Ethereum’s ERC-8004 Mainnet Launch An “iPhone Moment”, Here’s What It Means

Expert Tags Ethereum’s ERC-8004 Mainnet Launch An “iPhone Moment”, Here’s What It Means

Market analyst says Ethereum is having an “iPhone moment” as it approaches the ERC-8004 mainnet launch.
Share
Coinstats2026/02/08 19:56