Solana (SOL) Price: Tests Critical $124 Support Level as Technical Indicators Flash Warning Signs
TLDR
- Solana price trades at $130 after rejection from $150-$160, now testing multi-month support between $110-$120
- On-Balance Volume (OBV) shows compression inside defined channel alongside price, creating technical standoff between bulls and bears
- BisonFi DEX captured lead in Solana ecosystem with $4 billion in weekly volumes, while platform active users jumped 69% to 4.9 million
- Whale staked nearly 1 million SOL tokens worth $127 million until 2027, reducing liquid supply and anchoring lower range
- Three consecutive daily sell signals appeared while $125 support holds temporarily, with breakdown below $120 targeting $100
Solana is trading at $130 after failing to maintain levels above $145 in recent weeks. The token now sits in a range between $120 and $140 that traders view as critical for determining the next direction.
 Solana (SOL) Price
Price has returned to support between $110 and $120 that has acted as a demand zone across multiple moves over recent months. This zone represents the last major technical floor before lower levels around $100 come into play.
The current price action shows neither buyers nor sellers have clear control. Solana remains compressed between overhead resistance at $140-$145 and structural support at $110-$120.
On-chain data reveals mixed signals for the network. Weekly active users increased from 2.9 million in early January to 4.9 million last week. This represents a 69% rise in just two weeks.
DEX Activity Surges With New Protocol
A new decentralized exchange called BisonFi has taken the lead in Solana’s DEX segment. The automated market maker recorded $4 billion in weekly trading volumes, approaching established protocols like HumidiFi and Pump.fun.
BisonFi is backed by Forward Industries, which operates Solana’s largest digital asset treasury. The platform caters primarily to institutional traders.
Weekly DEX volumes on Solana jumped 43% in the past week. Meme coin launchpads including Pump.fun and a new platform called Bags contributed to this increase.
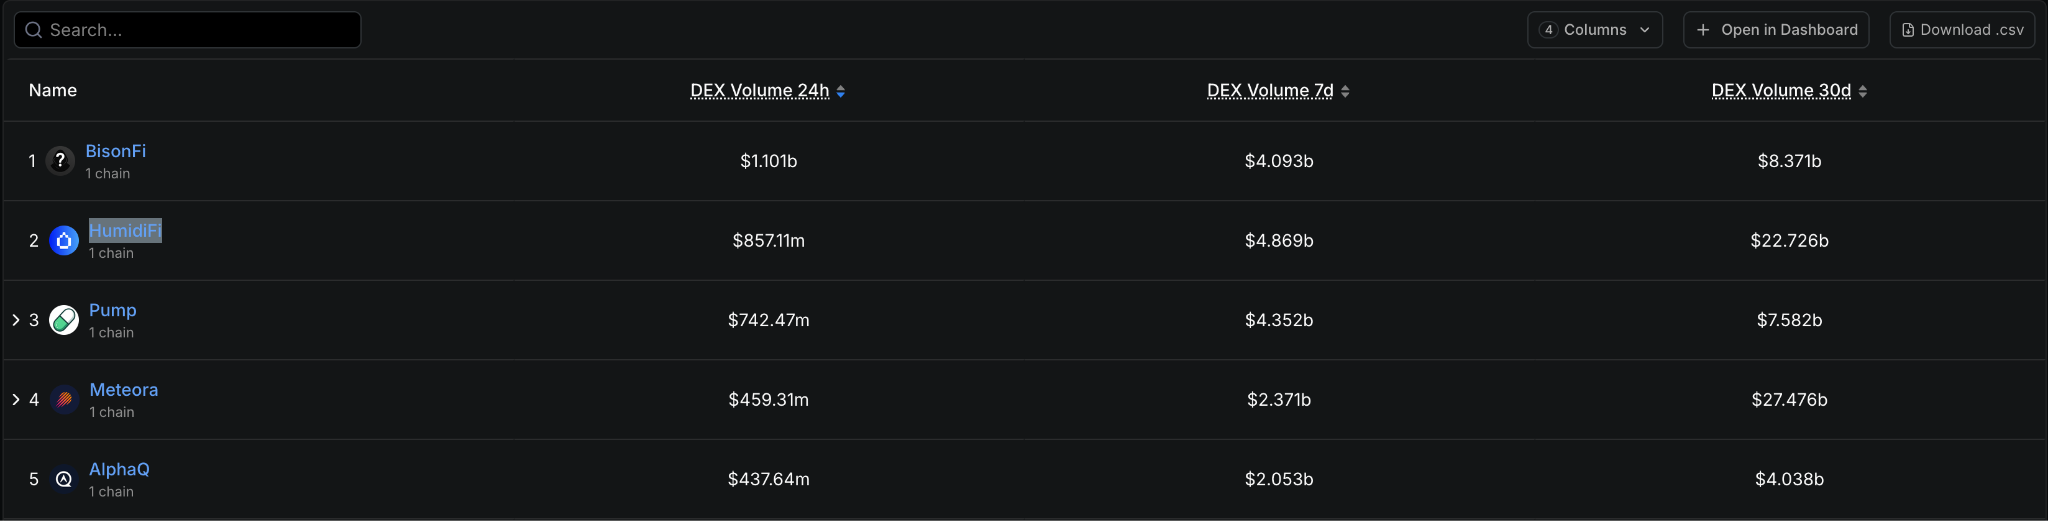 Source: DefiLlama
On-Balance Volume currently moves inside a defined channel along with price. This technical indicator tracks volume flow and can signal whether buyers or sellers are accumulating control.
If OBV breaks higher, it would provide fuel for price recovery toward $150-$160. If OBV rolls over and breaks lower, price would likely follow toward the $100 zone.
Whale Activity and Technical Levels
A whale recently staked nearly 1 million SOL tokens, locking over $127 million until 2027. This reduces the amount of liquid supply available near current price levels.
Large stakes at these levels often appear during base formation rather than distribution phases. This activity reinforces the technical relevance of the $110-$130 range.
The daily chart shows three consecutive sell signals appearing this week. The most recent signal flashed on Tuesday as the token reached support at $125.
Price bounced mildly off the $125 level but remains vulnerable. A breakdown below $125 would open the path to the low $100s, representing a 60% decline from recent peaks.
The 4-hour chart confirms bearish pressure with two consecutive sell signals this week. This increases the importance of the $125 support zone.
If $125 breaks, the next key level sits at $120. Solana bounced strongly from $120 in its last test, climbing to $145 afterward.
The token failed to reach new all-time highs during the recent bullish cycle while Ethereum and BNB both set new records. This underperformance reflects potential limitations in moving beyond meme coin use cases.
Current market structure shows Solana trapped in a defined range. A break above $140 would invalidate the downtrend and open recovery toward $150-$160. A break below $110 would confirm continuation lower with $100 as the next target.
Bears currently control price action in both daily and 4-hour timeframes. The market waits for either $140 resistance or $110 support to break before establishing a new trend.
The post Solana (SOL) Price: Tests Critical $124 Support Level as Technical Indicators Flash Warning Signs appeared first on CoinCentral.
You May Also Like

Three dormant wallets, suspected to belong to the same entity, purchased 5,970 ETH eight hours ago.

BlackRock Increases U.S. Stock Exposure Amid AI Surge