A 1.11% spike in the volatile crypto market comes as no surprise, with the prices oscillating between red and green candlesticks. With this, the overall sentimentA 1.11% spike in the volatile crypto market comes as no surprise, with the prices oscillating between red and green candlesticks. With this, the overall sentiment

Green in a Red Market: Can SKY’s Momentum Cut Through the Cloud After a 8% Jump?

2026/01/22 19:31
3 min read
  • SKY is trading at $0.066 after a 8% jump.
  • The 24-hour trading volume stands at $21M.

A 1.11% spike in the volatile crypto market comes as no surprise, with the prices oscillating between red and green candlesticks. With this, the overall sentiment lingers in the fear zone. Currently, most tokens are charted in green but could turn red at any time as they attempt to break free from bear-driven momentum.

Among the altcoins, SKY has registered a 8.47% jump within the last 24 hours, diverging from the broader trend. In the early hours, the asset traded at a bottom level of $0.06139, and with the asset breaking through a few crucial resistances, the price climbed to a high range of $0.06678. 

The CoinMarketCap data has reported that at the time of writing, SKY trades at around $0.06675, with its market cap staying at $1.53 billion. In the meantime, the daily trading volume of the asset has decreased and notably reached the $21.31 million mark.

With the active bullish trading pattern of SKY, the price could mount and test the significant resistance at $0.067. Upon the bulls gaining more traction, it initiates the emergence of a golden cross, and triggers the price to move up to attempt trading above $0.068. 

On the downside, a reversal might take off the recent gains. The SKY price is likely slip to the support at the $0.065 level. If the bearish correction strengthens, the death cross could take place, and the potential bears push the price down toward $0.064 or even lower. 

SKY Momentum Shows Signs of Bullish Strength

SKY’s Moving Average Convergence Divergence (MACD) crosses above the signal line, implying bullish momentum. This crossover shows that the price may continue to move higher, and it is an early sign of a potential uptrend. 

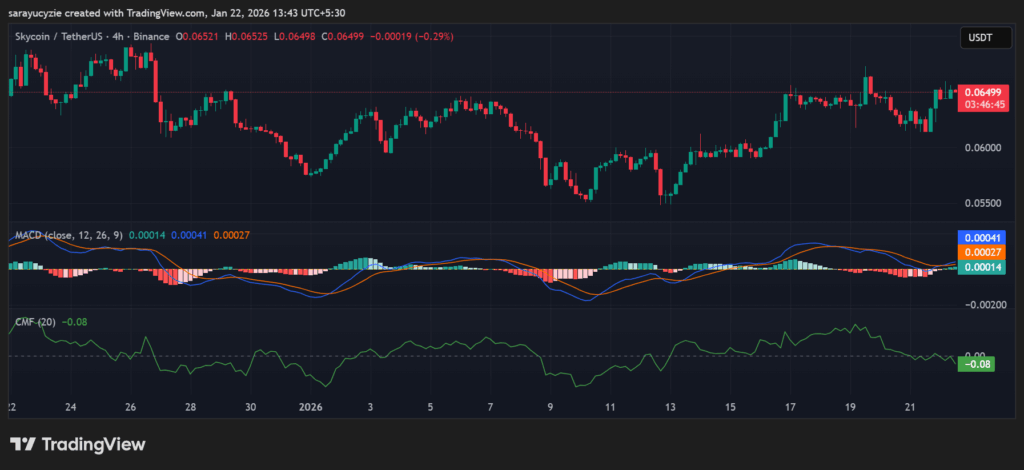
SKY chart (Source: TradingView)

In addition, the Chaikin Money Flow (CMF) indicator is resting at -0.08 points to mild selling pressure in the asset’s market. The capital is flowing out of the asset, with limited downside pressure rather than aggressive distribution. 

The daily Relative Strength Index (RSI) of SKY at 58.24 indicates moderate bullish sentiment. As it is trading above the neutral zone, buying pressure is growing. It leaves room for further upside if momentum continues. Notably, the Bull Bear Power (BBP) reading at 0.00214 suggests slight bullish dominance. Also, the market lacks strong commitment, and it may need more momentum to confirm a sustained move upward.

Top Updated Crypto News

From $4 to New Lows? OFFICIAL TRUMP (TRUMP) Tests Market Nerves

Disclaimer: The articles reposted on this site are sourced from public platforms and are provided for informational purposes only. They do not necessarily reflect the views of MEXC. All rights remain with the original authors. If you believe any content infringes on third-party rights, please contact service@support.mexc.com for removal. MEXC makes no guarantees regarding the accuracy, completeness, or timeliness of the content and is not responsible for any actions taken based on the information provided. The content does not constitute financial, legal, or other professional advice, nor should it be considered a recommendation or endorsement by MEXC.

You May Also Like

Pi Network Targets Open Mainnet 2026, Millions Prepare as Utility and Migration Accelerate

Pi Network Targets Open Mainnet 2026, Millions Prepare as Utility and Migration Accelerate

The Pi Network community is once again buzzing with renewed optimism following a powerful message circulating on social media regarding the project’s roadmap t
Share
Hokanews2026/02/07 20:41
Bitcoin Rainbow chart predicts BTC price for October 1, 2025

Bitcoin Rainbow chart predicts BTC price for October 1, 2025

The post Bitcoin Rainbow chart predicts BTC price for October 1, 2025 appeared on BitcoinEthereumNews.com. The Bitcoin (BTC) Rainbow Chart has outlined potential price ranges for October 1, 2025, as the asset seeks to reclaim the $120,000 resistance. Throughout September, the maiden cryptocurrency has struggled to push past the $115,000 support zone. At press time, Bitcoin was trading at $115,950, up 0.15% in the past 24 hours and gaining a modest 0.5% over the past week. Bitcoin seven-day price chart. Source: Finbold Looking ahead to October 1, the Rainbow Chart projects that Bitcoin’s price could fall within a broad band of $36,628 to $409,726, depending on prevailing market sentiment. The Rainbow Chart, a long-term valuation model often used to track Bitcoin’s price cycles, is built as a logarithmic regression chart. It color-codes Bitcoin’s valuation bands, offering investors a simplified way to gauge whether the market is undervalued or overheated. Bitcoin price prediction  The lowest tier, labeled “Basically a Fire Sale,” spans from $36,628 to $47,947. Above that, the “BUY!” zone ranges from $47,947 to $64,777, while “Accumulate” covers $64,777 to $83,811. The “Still Cheap” band sets Bitcoin between $83,811 and $108,471, followed by the neutral “HODL!” zone at $108,471 to $142,332. Bitcoin Rainbow chart. Source: BlockhainCenter Cautionary levels emerge as prices climb higher. In this case, the “Is this a bubble?” range extends from $142,332 to $181,644, while “FOMO intensifies” lies between $181,644 and $233,215. On the other hand, the red zones, seen as overheated territory, start with “Sell. Seriously, SELL!” at $233,215 to $304,169 and peak with “Maximum Bubble Territory” from $304,169 to $409,726. With Bitcoin trading around $116,000 as of September 20, the Rainbow Chart suggests that by October 1, 2025, the asset will most likely fall within the “Still Cheap” or “HODL!” bands, implying a fair value between $83,811 and $142,332. This outlook indicates that despite Bitcoin’s strong gains, the model places…
Share
BitcoinEthereumNews2025/09/21 01:51
White House Schedules Tuesday Stablecoin Talks as Banks Enter the Room

White House Schedules Tuesday Stablecoin Talks as Banks Enter the Room

The White House will host crypto firms and banks on February 10 to continue talks on stablecoin rules and advance the crypto market bill. The White House has set
Share
LiveBitcoinNews2026/02/07 19:45