Bitcoin and most altcoins pulled back on Tuesday, raising concerns among investors about whether the crypto bull run is over. Bitcoin (BTC) plunged from Monday’s high of $123,200 to $116,600, while the market capitalization of all coins fell by over…Bitcoin and most altcoins pulled back on Tuesday, raising concerns among investors about whether the crypto bull run is over. Bitcoin (BTC) plunged from Monday’s high of $123,200 to $116,600, while the market capitalization of all coins fell by over…

Is the crypto bull run over? Here’s why Bitcoin and altcoins are going down

3 min read

Bitcoin and most altcoins pulled back on Tuesday, raising concerns among investors about whether the crypto bull run is over.

Bitcoin (BTC) plunged from Monday’s high of $123,200 to $116,600, while the market capitalization of all coins fell by over 3.7% to $3.65 trillion. Some of the worst-performing tokens were Pump (PUMP), Virtuals Protocol (VIRTUAL), SPX6900 (SPX), and Fartcoin (FARTCOIN), respectively. 

Bitcoin and most altcoins declined due to profit-taking among investors. It is common for cryptocurrencies and stocks to pull back slightly after going parabolic. For example, BTC reached a record high of $109,389 in January, then pulled back to $74,450 in April.

Cryptocurrencies are also falling as market participants await the outcome of “Crypto Week.” Republicans will consider three bills this week, including CLARITY, GENIUS, and one related to central bank digital currencies.

The GENIUS Act, which passed in a bipartisan manner in the Senate, sets the rules for stablecoins. CLARITY aims to divide the cryptocurrency regulatory roles between the SEC and the CFTC, while the CBDC bill prohibits the Fed from working on these currencies.

Therefore, Bitcoin and altcoins are falling because market participants are not sure whether these bills will pass in Congress. Many of them remember Donald Trump’s “Infrastructure Week” during his first term. His goal was to secure $1 trillion to fund the country’s infrastructure, which did not materialize.

Further, these coins are likely falling due to the concept known as “buy the rumor, sell the news.” Cryptocurrencies surged ahead of “Crypto Week” and are now declining as the event unfolds.

Is the crypto bull run over?

Bitcoin price

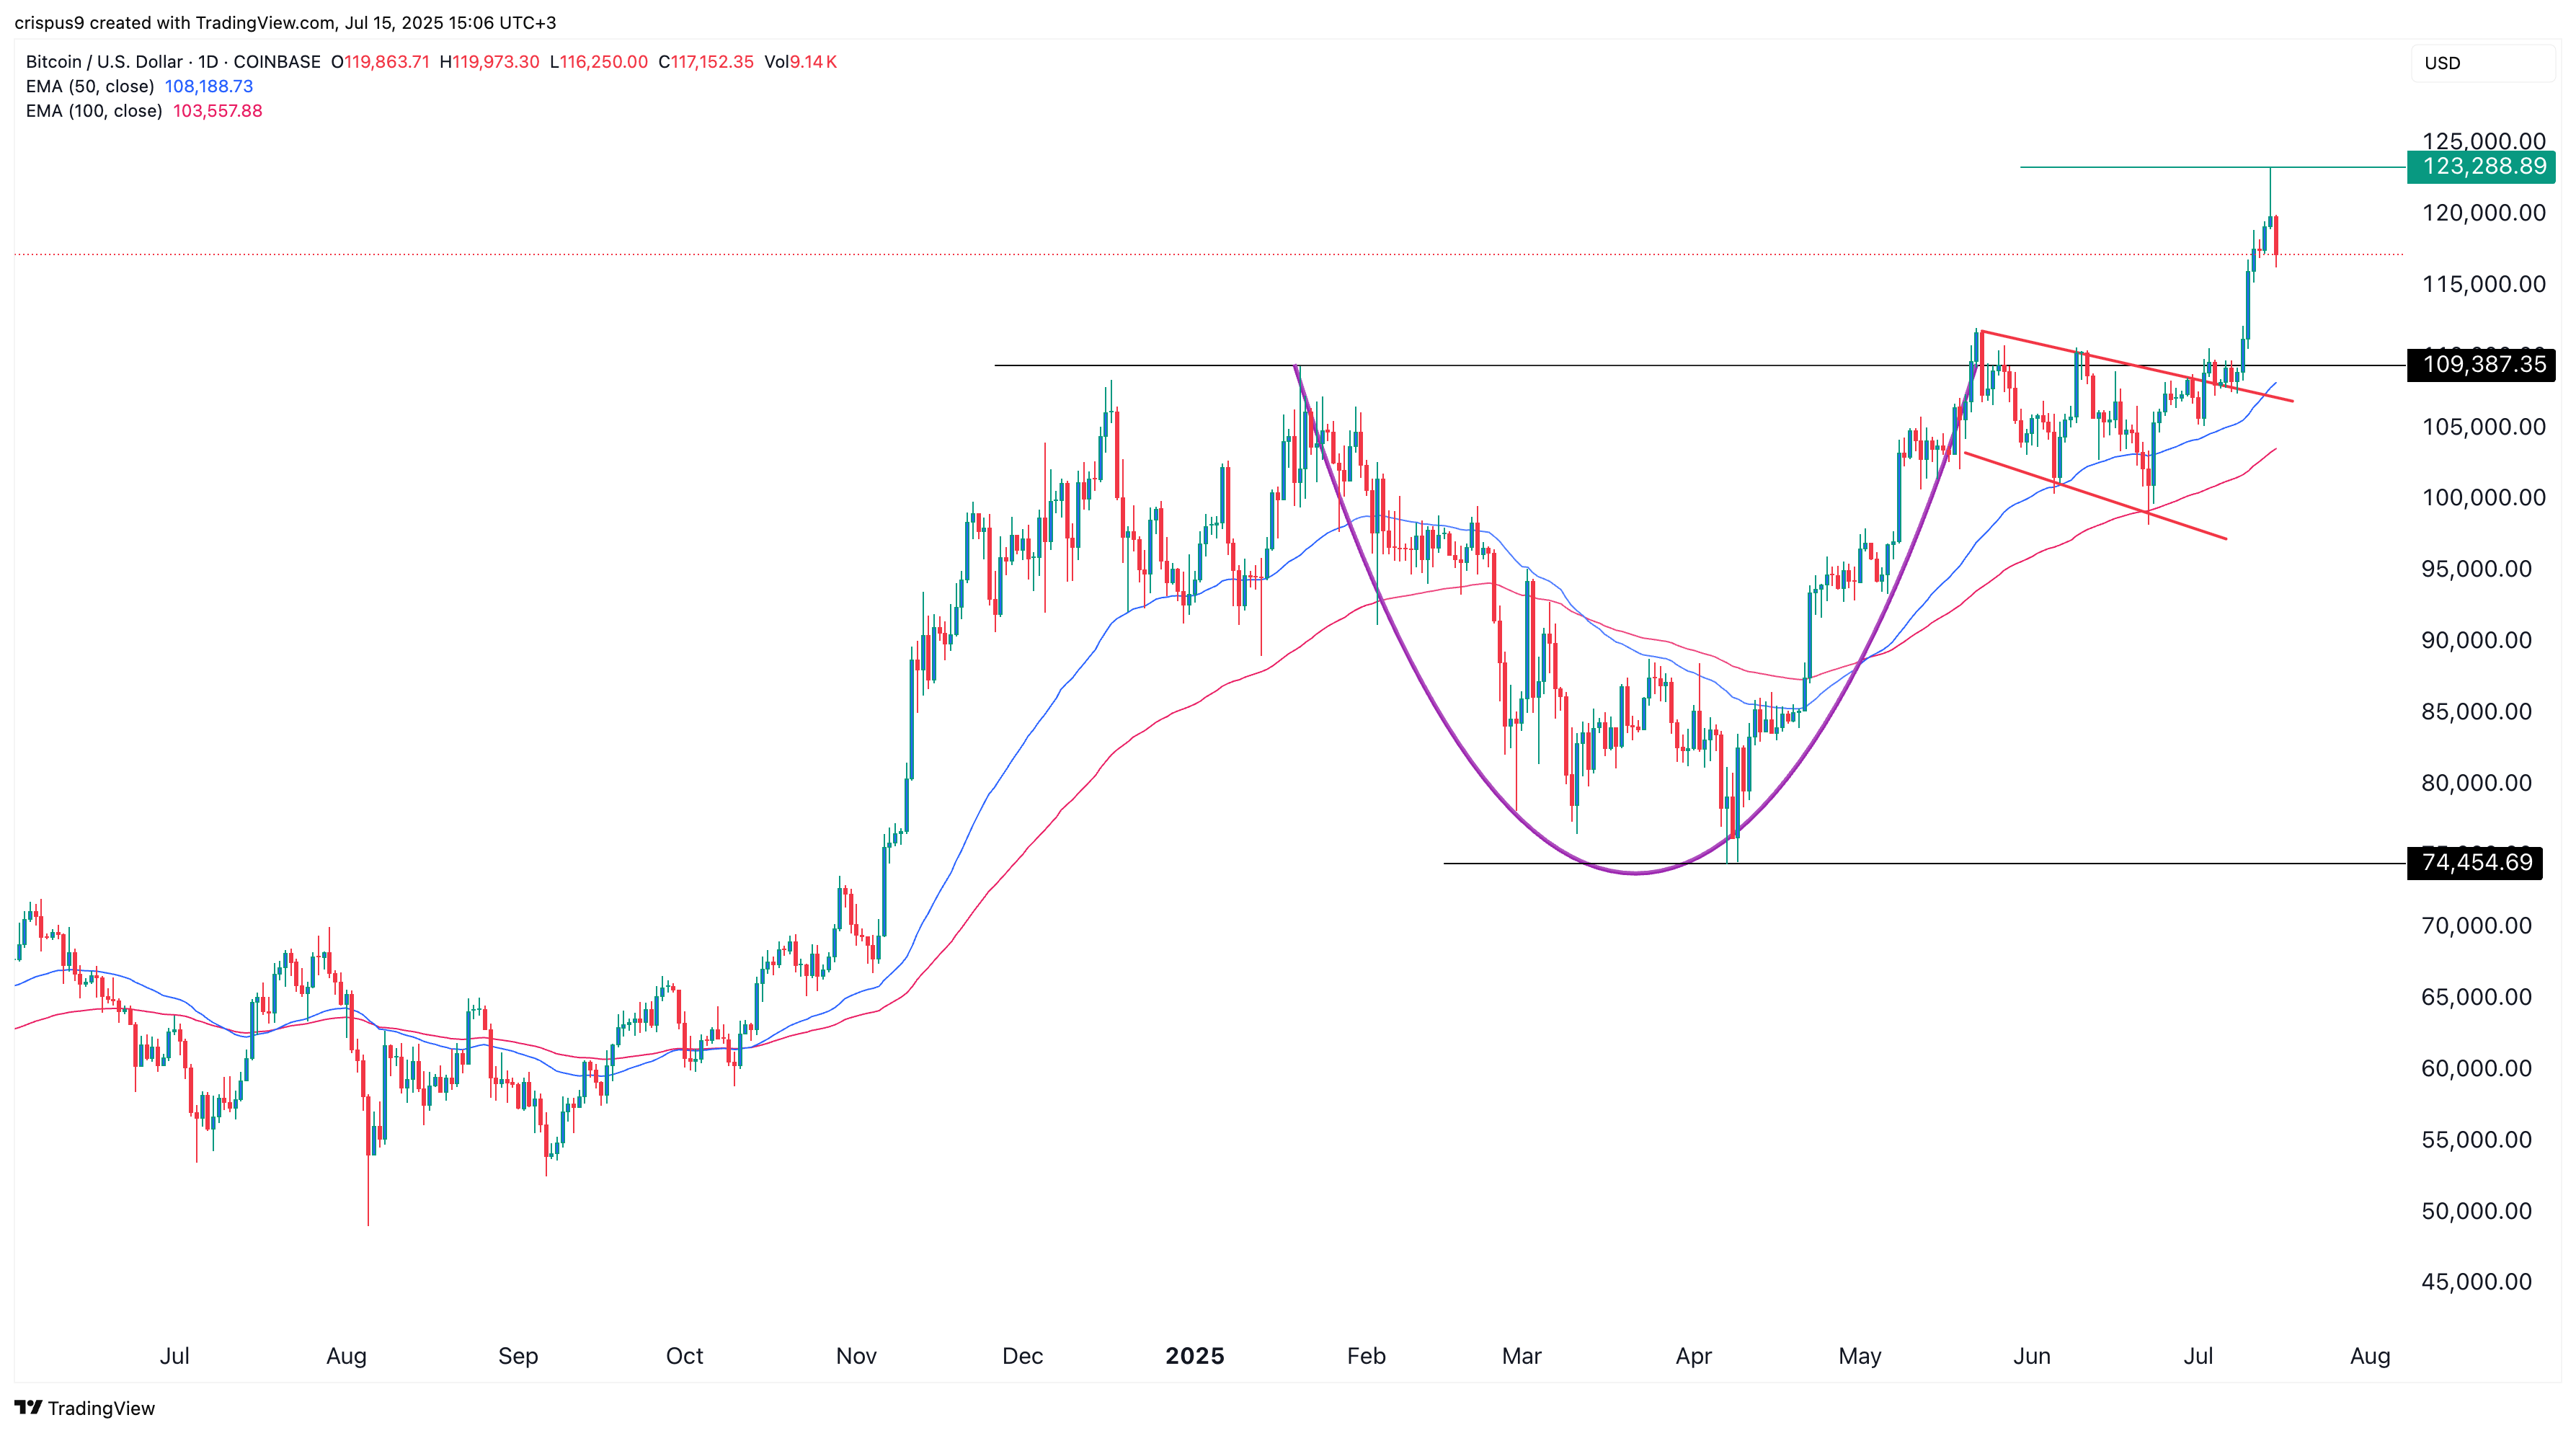
The crypto pullback is also happening due to technical factors. The chart above shows that Bitcoin price formed a shooting star pattern on Monday. This pattern, characterized by a small body and a long upper shadow, is one of the most common bearish reversal signals.

Bitcoin is also falling due to mean reversion, where an asset returns to its historical averages. In this case, BTC surged above $123,000 on Monday, significantly higher than the 100-day moving average of $103,000 and the 50-day average of $108,200. As such, mean reversion suggests that BTC may keep falling to bridge this gap.

Bitcoin also appears to be executing a break-and-retest pattern by moving back to the key support at $110,000. This B&R pattern is a common continuation signal in technical analysis.

Therefore, this is unlikely to mark the end of the crypto bull run. The more probable scenario is that BTC drops to $110,000 and then resumes its uptrend, potentially triggering another rally among altcoins.

Market Opportunity
Bitcoin Logo
Bitcoin Price(BTC)
$72,327.03
$72,327.03$72,327.03
-2.42%
USD
Bitcoin (BTC) Live Price Chart
Disclaimer: The articles reposted on this site are sourced from public platforms and are provided for informational purposes only. They do not necessarily reflect the views of MEXC. All rights remain with the original authors. If you believe any content infringes on third-party rights, please contact service@support.mexc.com for removal. MEXC makes no guarantees regarding the accuracy, completeness, or timeliness of the content and is not responsible for any actions taken based on the information provided. The content does not constitute financial, legal, or other professional advice, nor should it be considered a recommendation or endorsement by MEXC.

You May Also Like

Securities Fraud Investigation Into Corcept Therapeutics Incorporated (CORT) Announced – Shareholders Who Lost Money Urged To Contact Glancy Prongay Wolke & Rotter LLP, a Leading Securities Fraud Law Firm

Securities Fraud Investigation Into Corcept Therapeutics Incorporated (CORT) Announced – Shareholders Who Lost Money Urged To Contact Glancy Prongay Wolke & Rotter LLP, a Leading Securities Fraud Law Firm

LOS ANGELES–(BUSINESS WIRE)–Glancy Prongay Wolke & Rotter LLP, a leading national shareholder rights law firm, today announced that it has commenced an investigation
Share
AI Journal2026/02/05 04:00
Microsoft Corp. $MSFT blue box area offers a buying opportunity

Microsoft Corp. $MSFT blue box area offers a buying opportunity

The post Microsoft Corp. $MSFT blue box area offers a buying opportunity appeared on BitcoinEthereumNews.com. In today’s article, we’ll examine the recent performance of Microsoft Corp. ($MSFT) through the lens of Elliott Wave Theory. We’ll review how the rally from the April 07, 2025 low unfolded as a 5-wave impulse followed by a 3-swing correction (ABC) and discuss our forecast for the next move. Let’s dive into the structure and expectations for this stock. Five wave impulse structure + ABC + WXY correction $MSFT 8H Elliott Wave chart 9.04.2025 In the 8-hour Elliott Wave count from Sep 04, 2025, we saw that $MSFT completed a 5-wave impulsive cycle at red III. As expected, this initial wave prompted a pullback. We anticipated this pullback to unfold in 3 swings and find buyers in the equal legs area between $497.02 and $471.06 This setup aligns with a typical Elliott Wave correction pattern (ABC), in which the market pauses briefly before resuming its primary trend. $MSFT 8H Elliott Wave chart 7.14.2025 The update, 10 days later, shows the stock finding support from the equal legs area as predicted allowing traders to get risk free. The stock is expected to bounce towards 525 – 532 before deciding if the bounce is a connector or the next leg higher. A break into new ATHs will confirm the latter and can see it trade higher towards 570 – 593 area. Until then, traders should get risk free and protect their capital in case of a WXY double correction. Conclusion In conclusion, our Elliott Wave analysis of Microsoft Corp. ($MSFT) suggested that it remains supported against April 07, 2025 lows and bounce from the blue box area. In the meantime, keep an eye out for any corrective pullbacks that may offer entry opportunities. By applying Elliott Wave Theory, traders can better anticipate the structure of upcoming moves and enhance risk management in volatile markets. Source: https://www.fxstreet.com/news/microsoft-corp-msft-blue-box-area-offers-a-buying-opportunity-202509171323
Share
BitcoinEthereumNews2025/09/18 03:50
Over 80% of 135 Ethereum L2s record below 1 user operation per second

Over 80% of 135 Ethereum L2s record below 1 user operation per second

The post Over 80% of 135 Ethereum L2s record below 1 user operation per second  appeared on BitcoinEthereumNews.com. Ethereum’s L2s are not doing too well. Data
Share
BitcoinEthereumNews2026/02/05 03:52