Onyxcoin price remains one of the strongest movers this month, but recent action tells a more nuanced story. XCN is still up nearly 97% over the past seven daysOnyxcoin price remains one of the strongest movers this month, but recent action tells a more nuanced story. XCN is still up nearly 97% over the past seven days

Onyxcoin Price Prediction: 290 Million Whale Buying Gives Critical Hint

Onyxcoin price remains one of the strongest movers this month, but recent action tells a more nuanced story. XCN is still up nearly 97% over the past seven days, yet that headline gain hides a sharp shakeout. Since January 6, the token has corrected by roughly 36%, after briefly touching $0.0130.

That pullback has not broken the structure. Instead, the XCN price is now consolidating within a bullish flag after rebounding over 4% day-on-day, while large holders step in and selling pressure fades. The key question is whether XCN will be able to initiate the explosive breakout it has been seeking for a while now.

Bullish Flag Holds as Key Signs Emerge

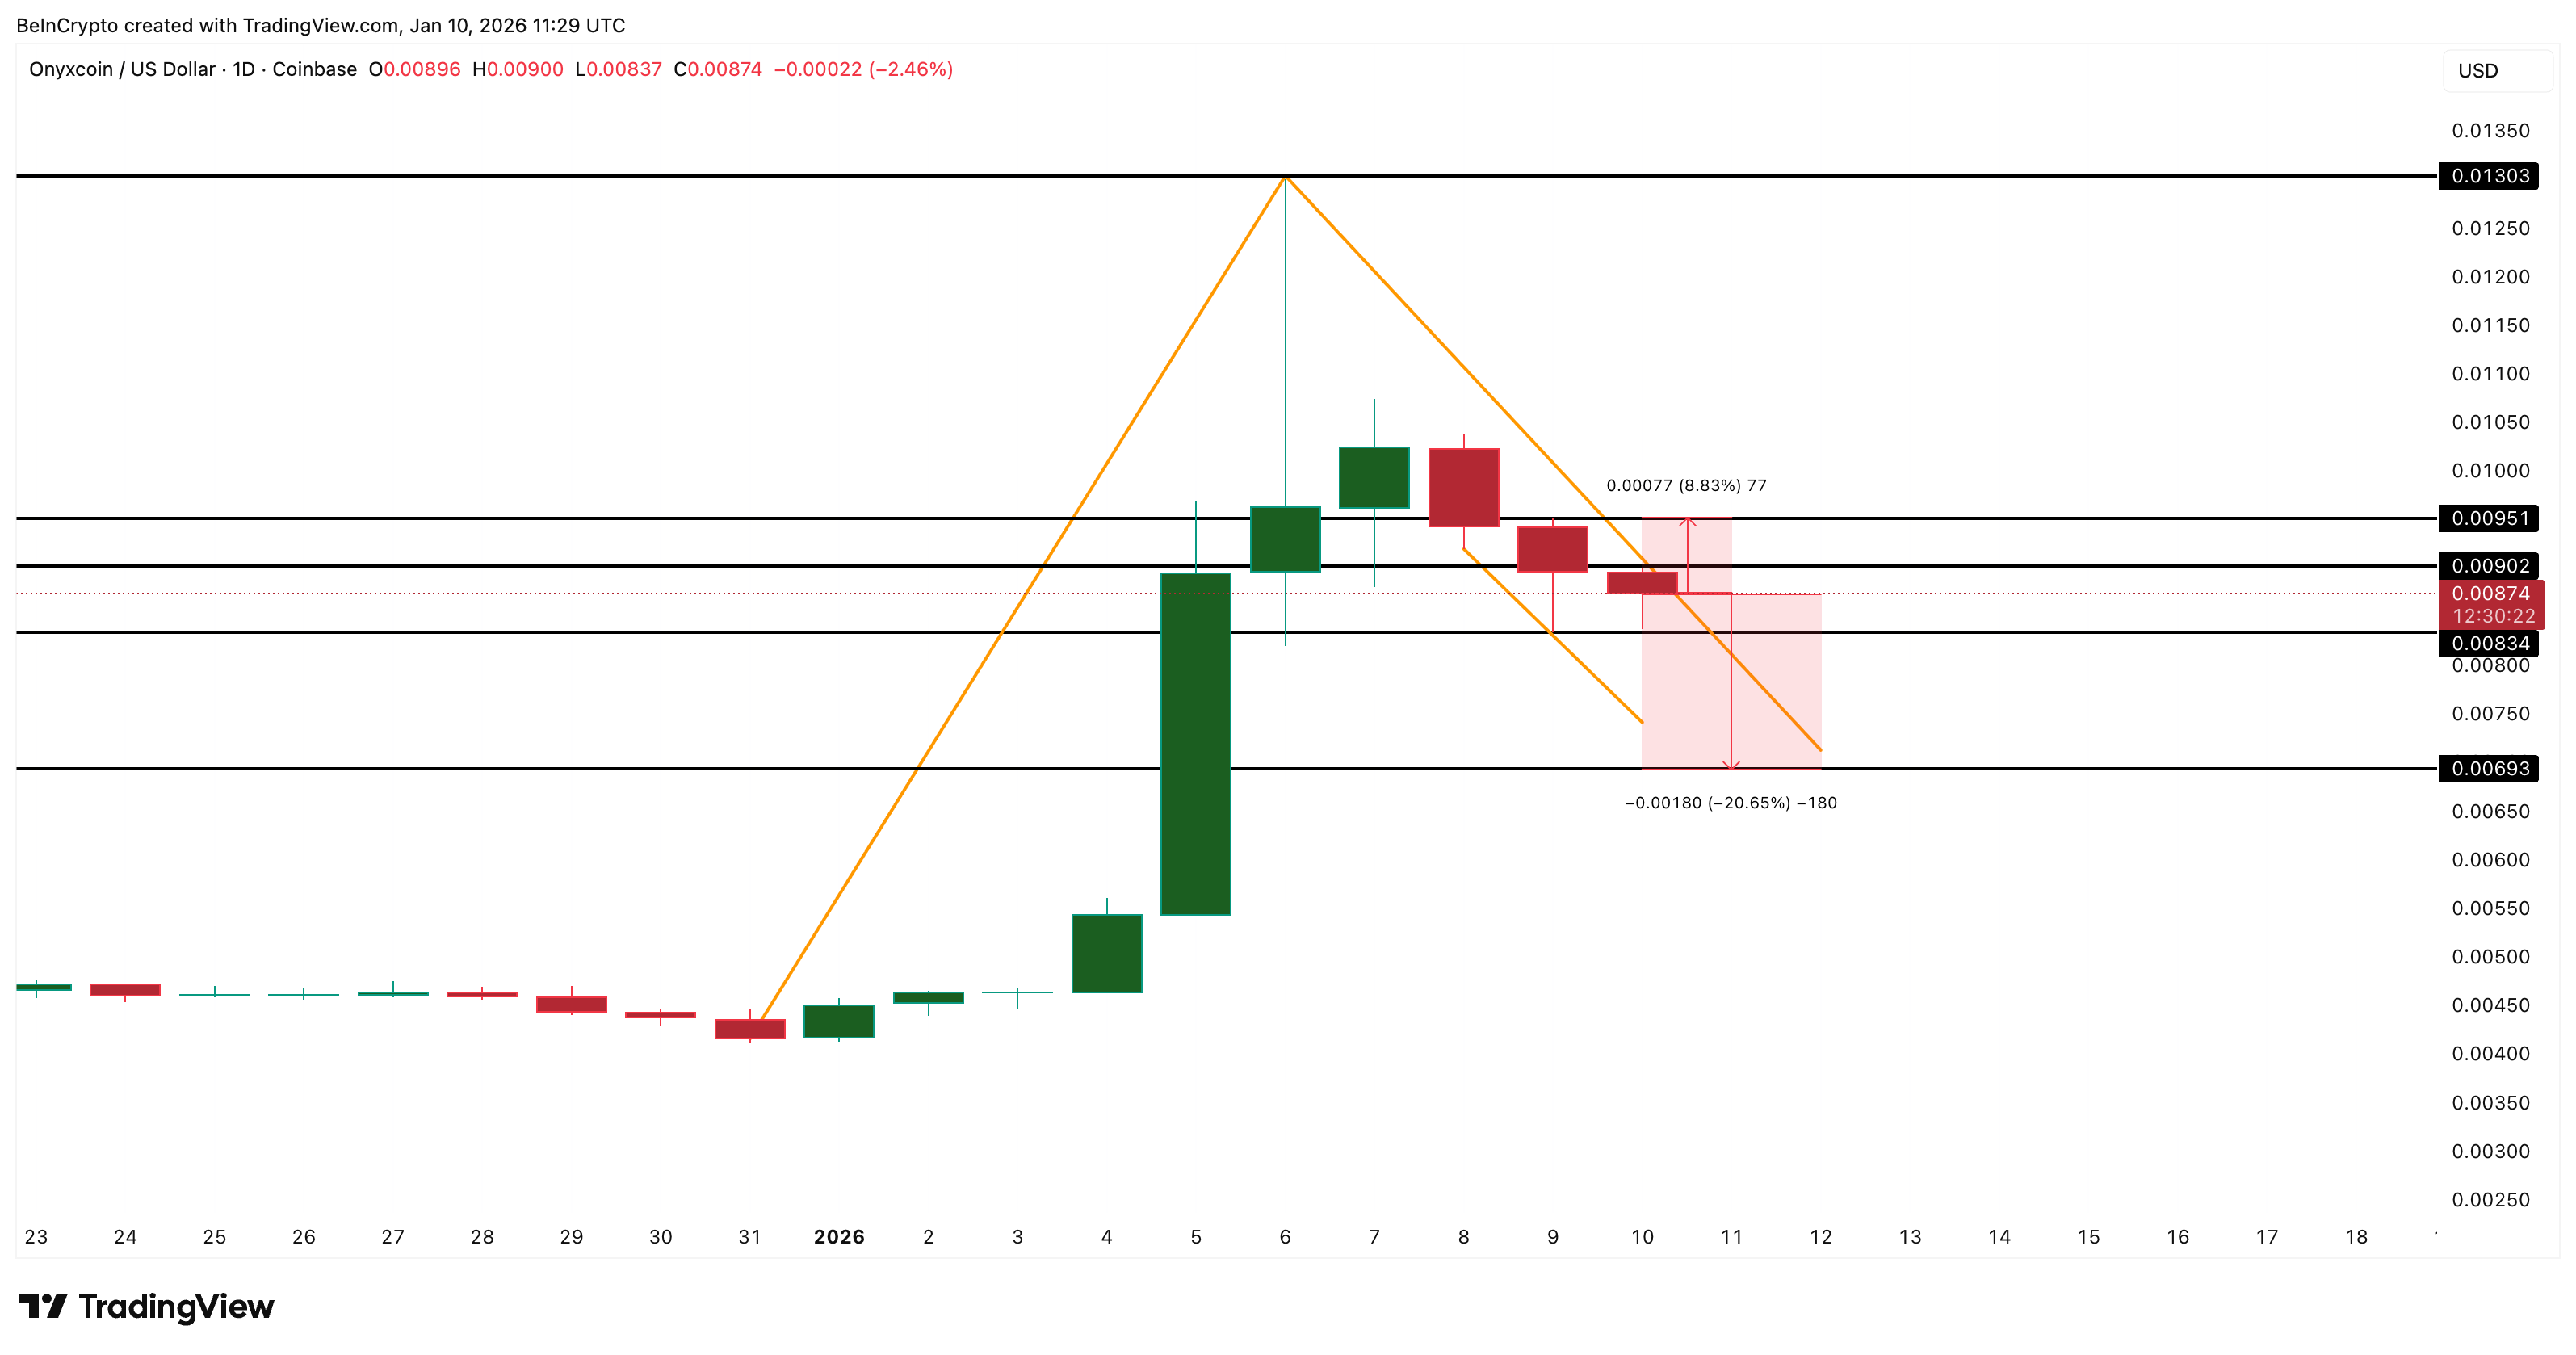
On the daily chart, Onyxcoin is consolidating inside a classic bull flag pattern. A bull flag forms after a strong vertical move, followed by a downward-sloping range that allows price to cool without breaking the broader trend. XCN is currently trading close to the upper boundary of this flag, suggesting pressure is building.

A breakout above the key resistance at $0.0095 could kickstart the 218% breakout path, the pole’s measured move.

XCN Breakout Structure
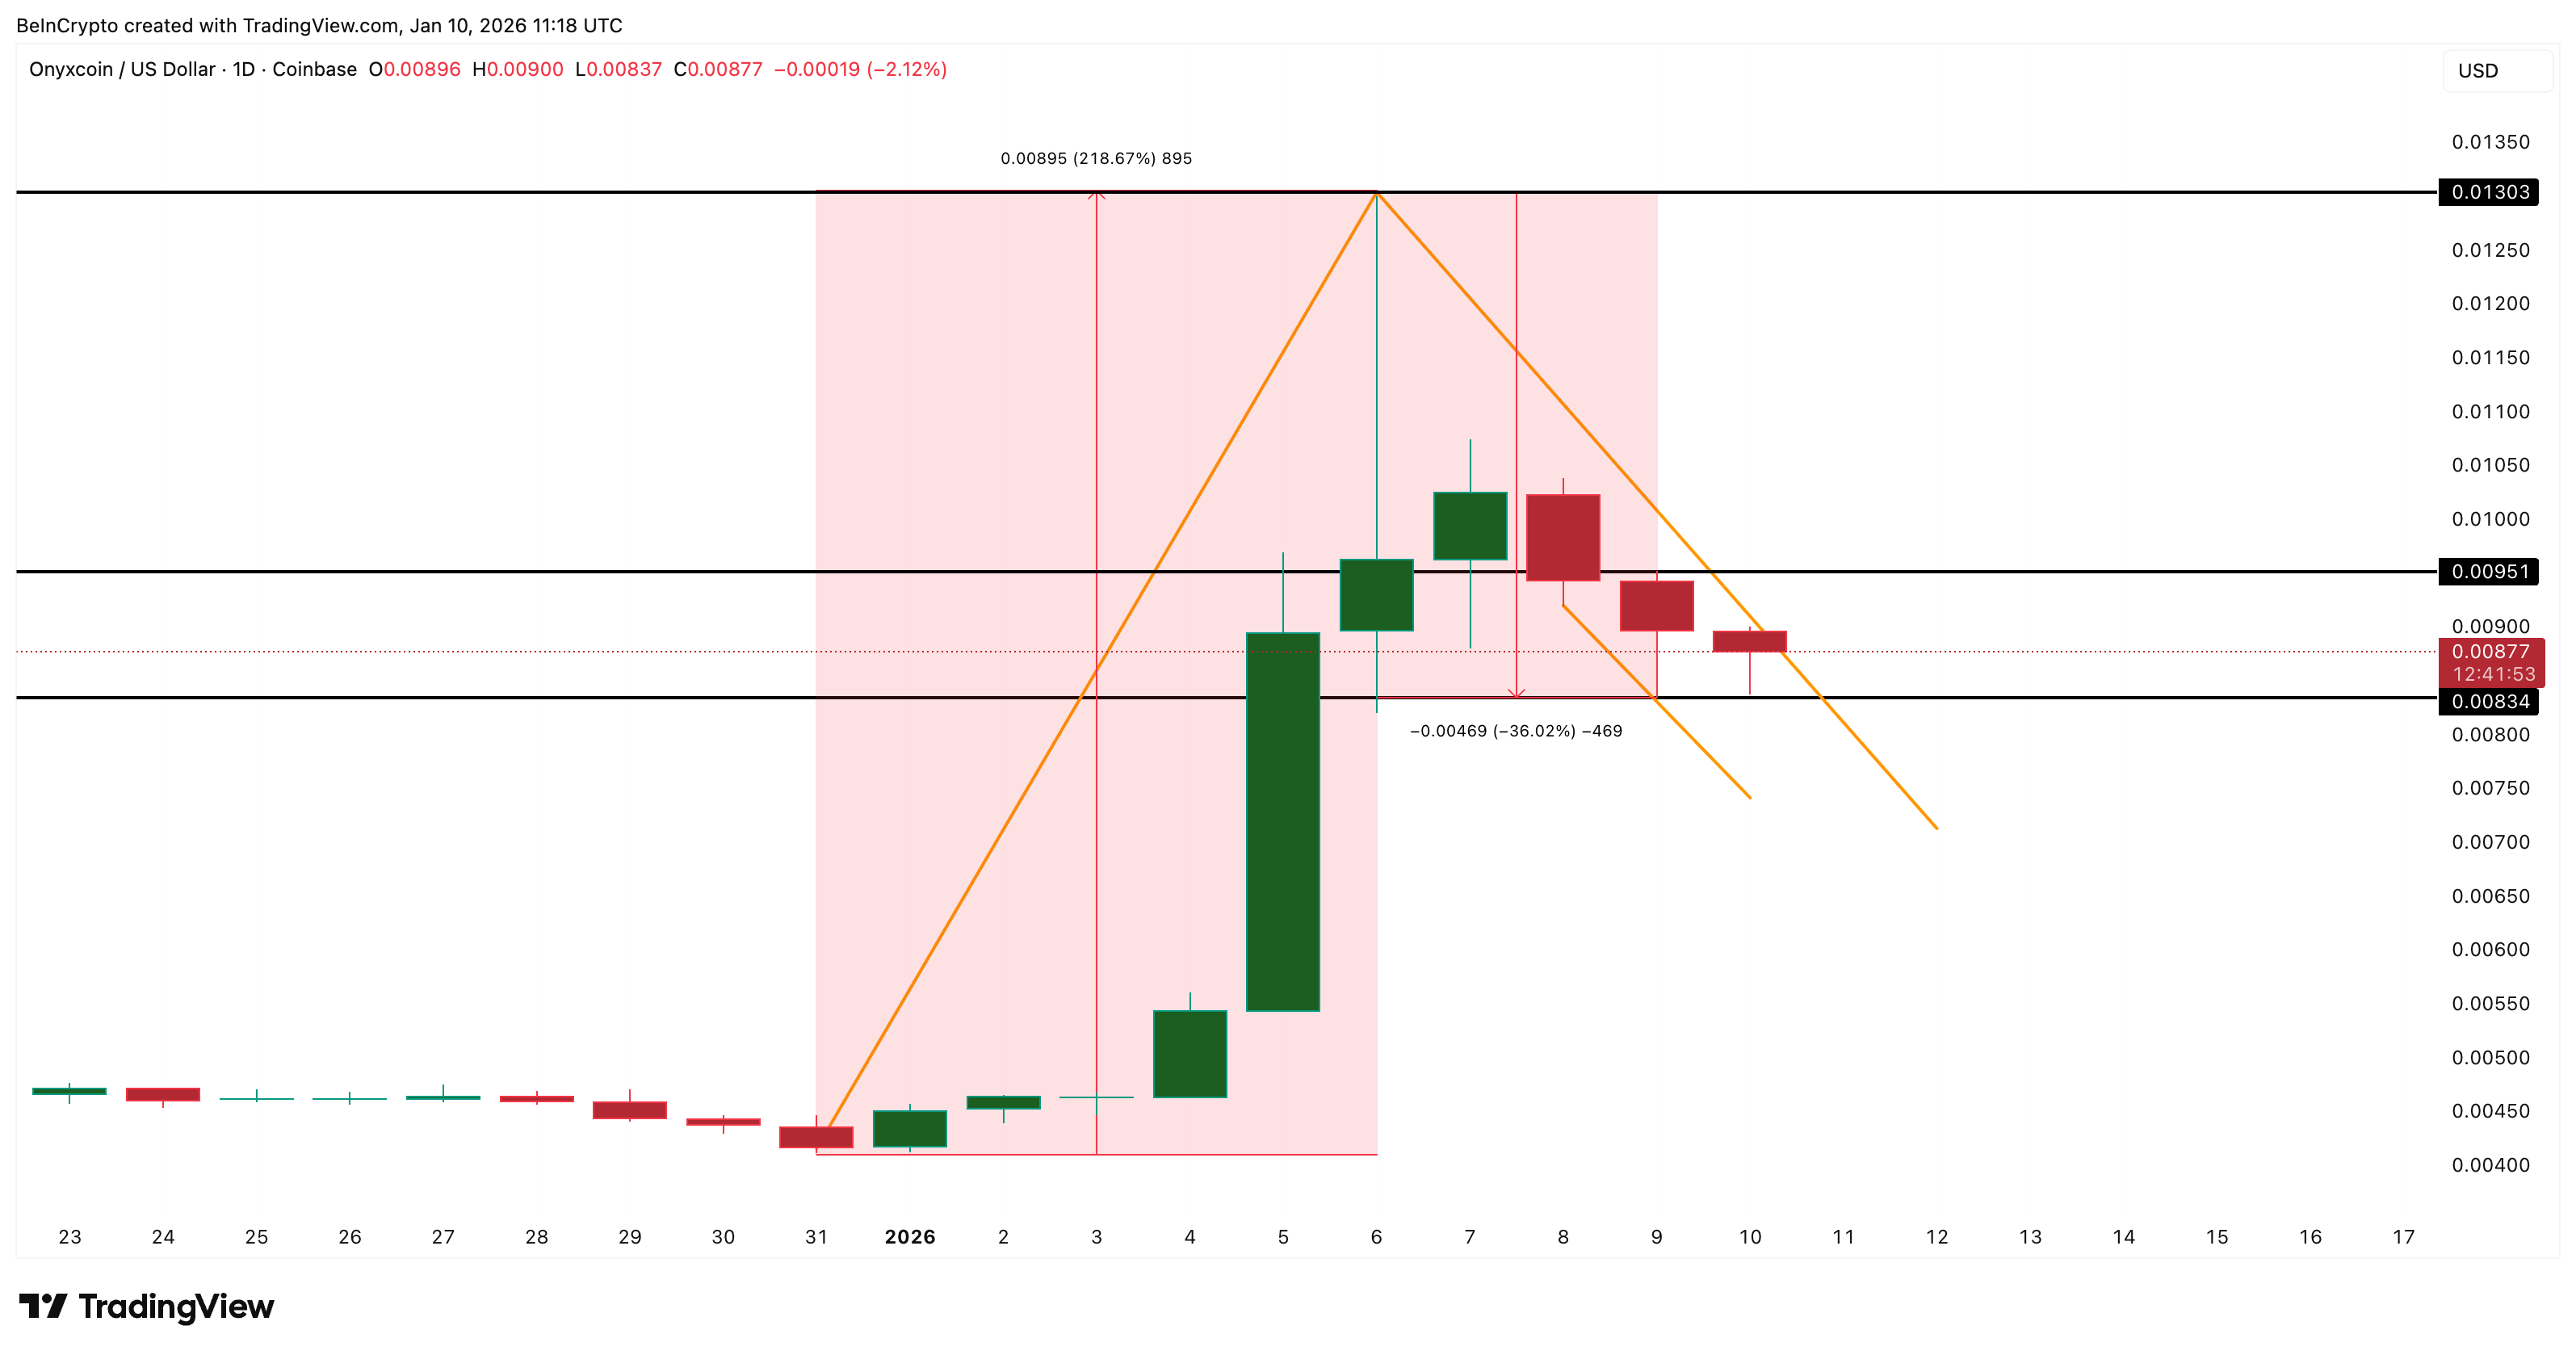
XCN Breakout Structure: TradingView

Want more token insights like this? Sign up for Editor Harsh Notariya’s Daily Crypto Newsletter here.

Moving averages add context. An Exponential Moving Average, or EMA, gives more weight to recent prices and helps track short-term trend shifts. Onyxcoin’s 20-day EMA is now rising toward the 100-day EMA, signaling a potential bullish crossover if momentum holds.

EMA Support
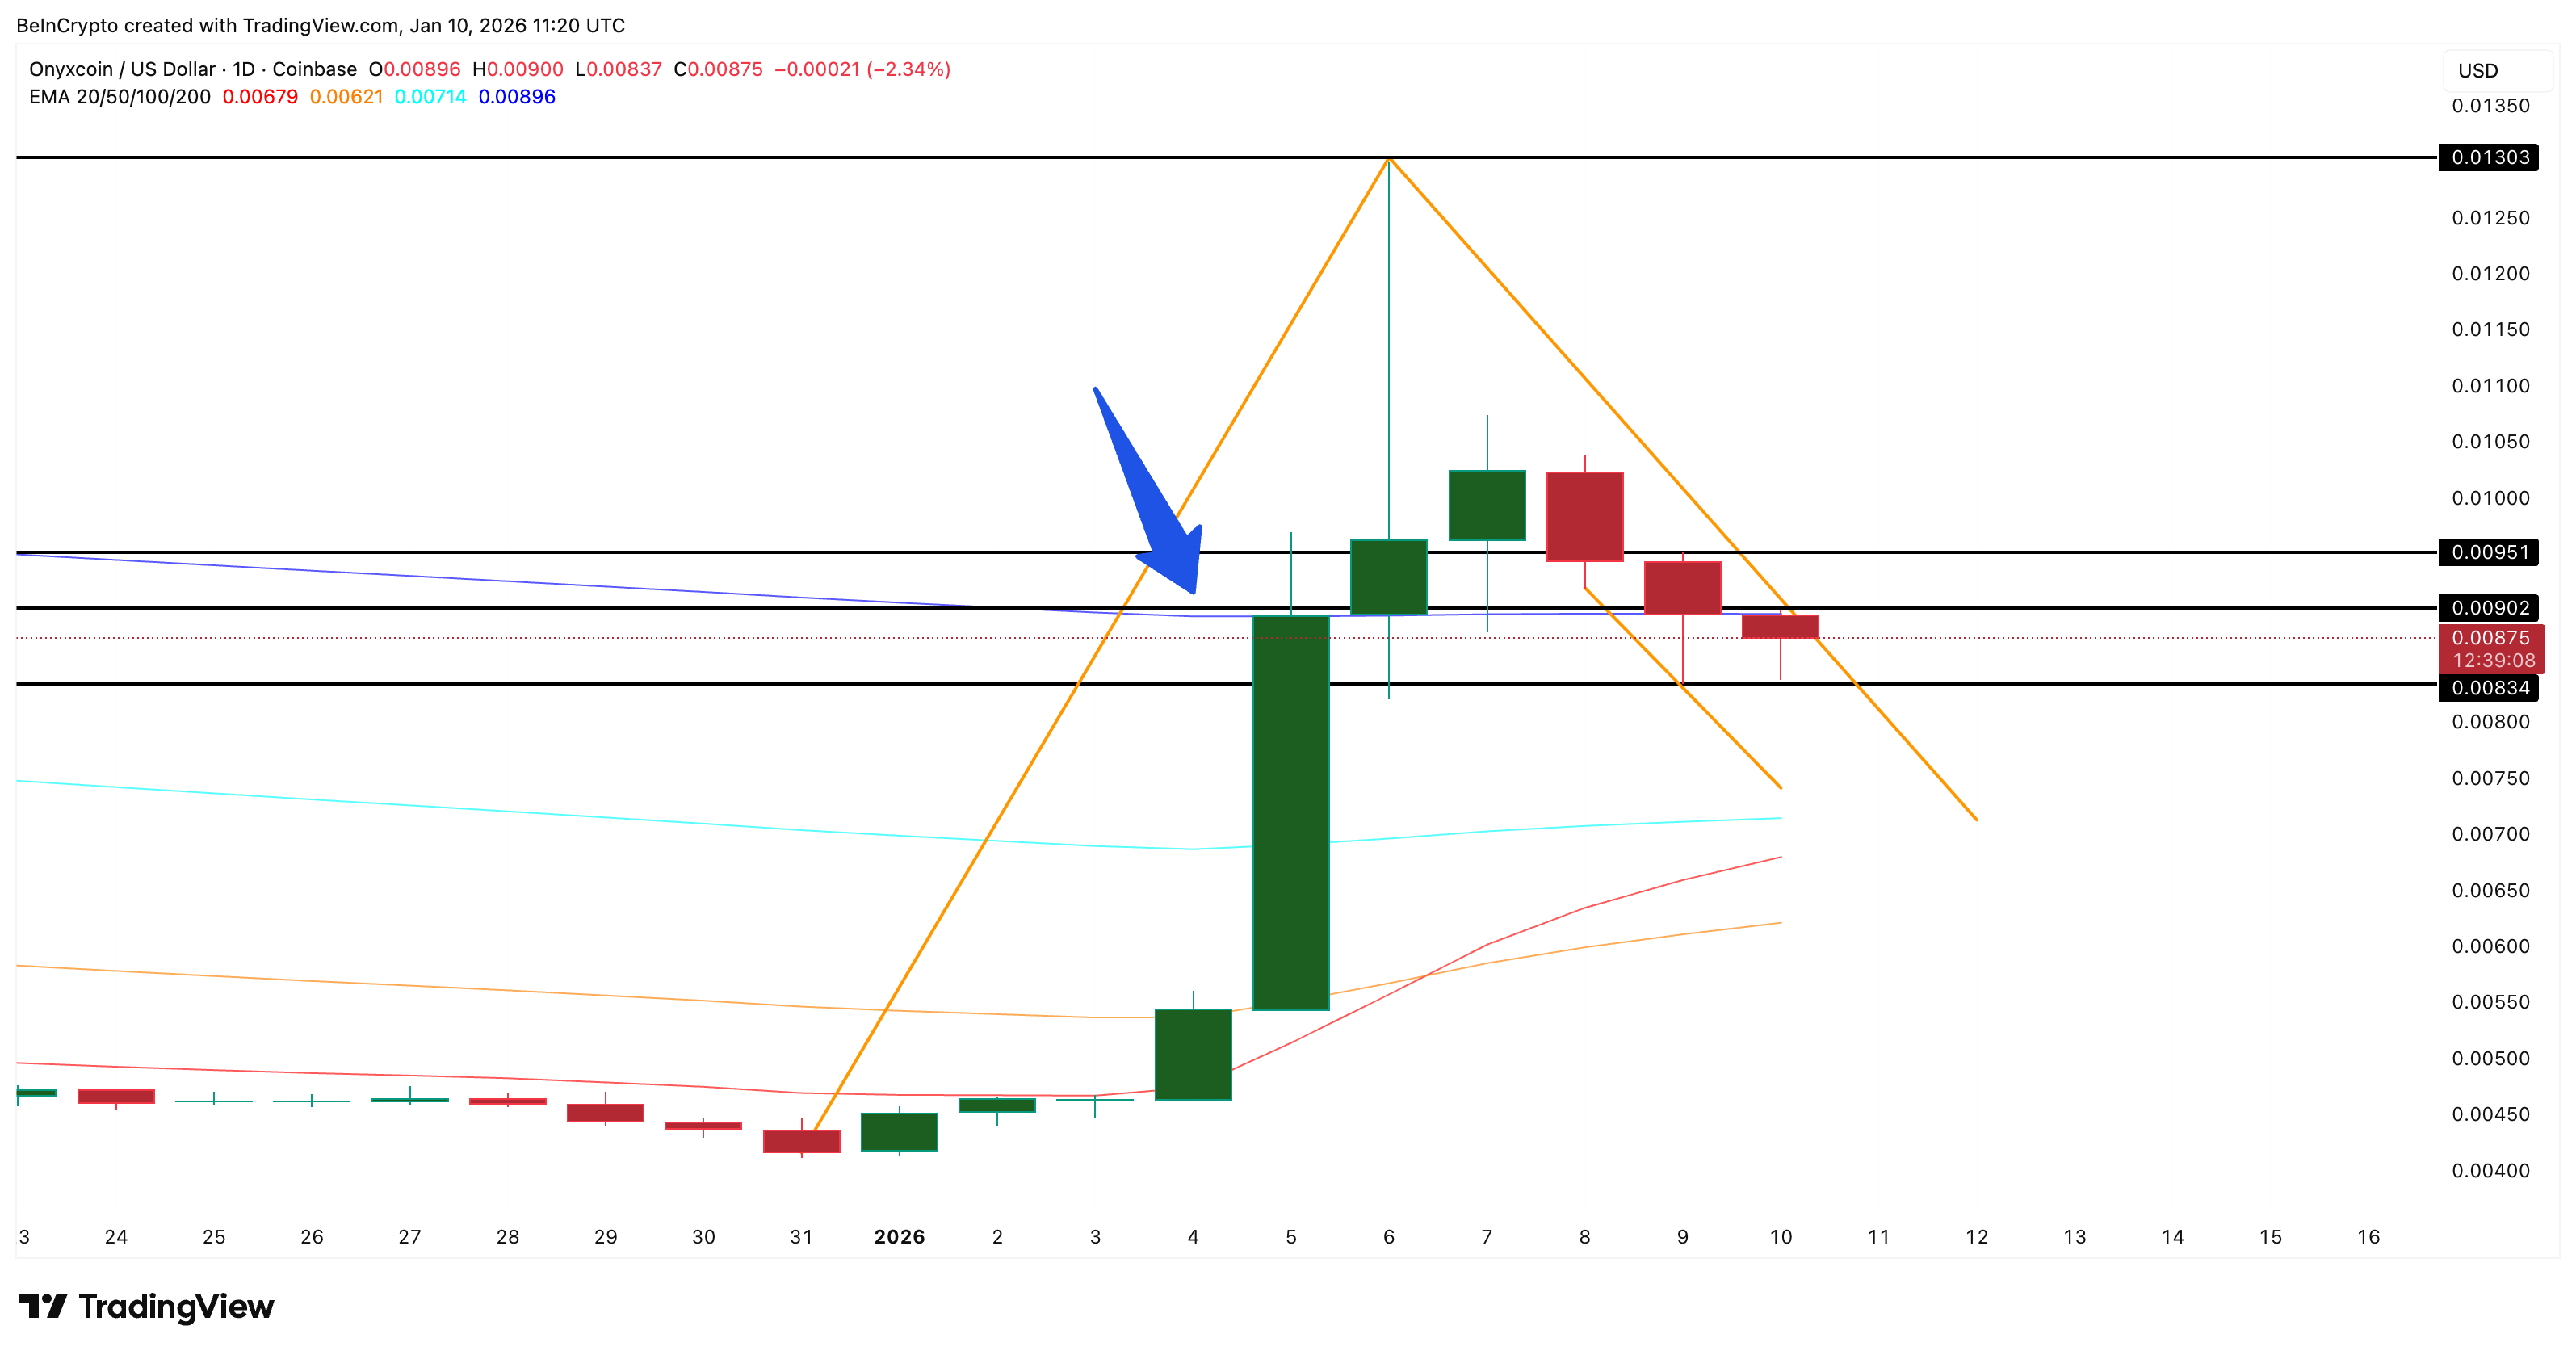
EMA Support: TradingView

The 200-day EMA is especially important here. During the previous rally that began at the end of December, XCN accelerated once the price reclaimed this long-term trend line. Price is again hovering near that same level. A clean move above the 200-day EMA would strengthen the flag breakout case and confirm that buyers remain in control.

So far, the price has not broken the bullish pattern despite the 36% dip that started on January 6. This appears to be a consolidation, not a rejection.

Whale Accumulation Grows as Selling Pressure Fades

On-chain data supports the bullish setup.

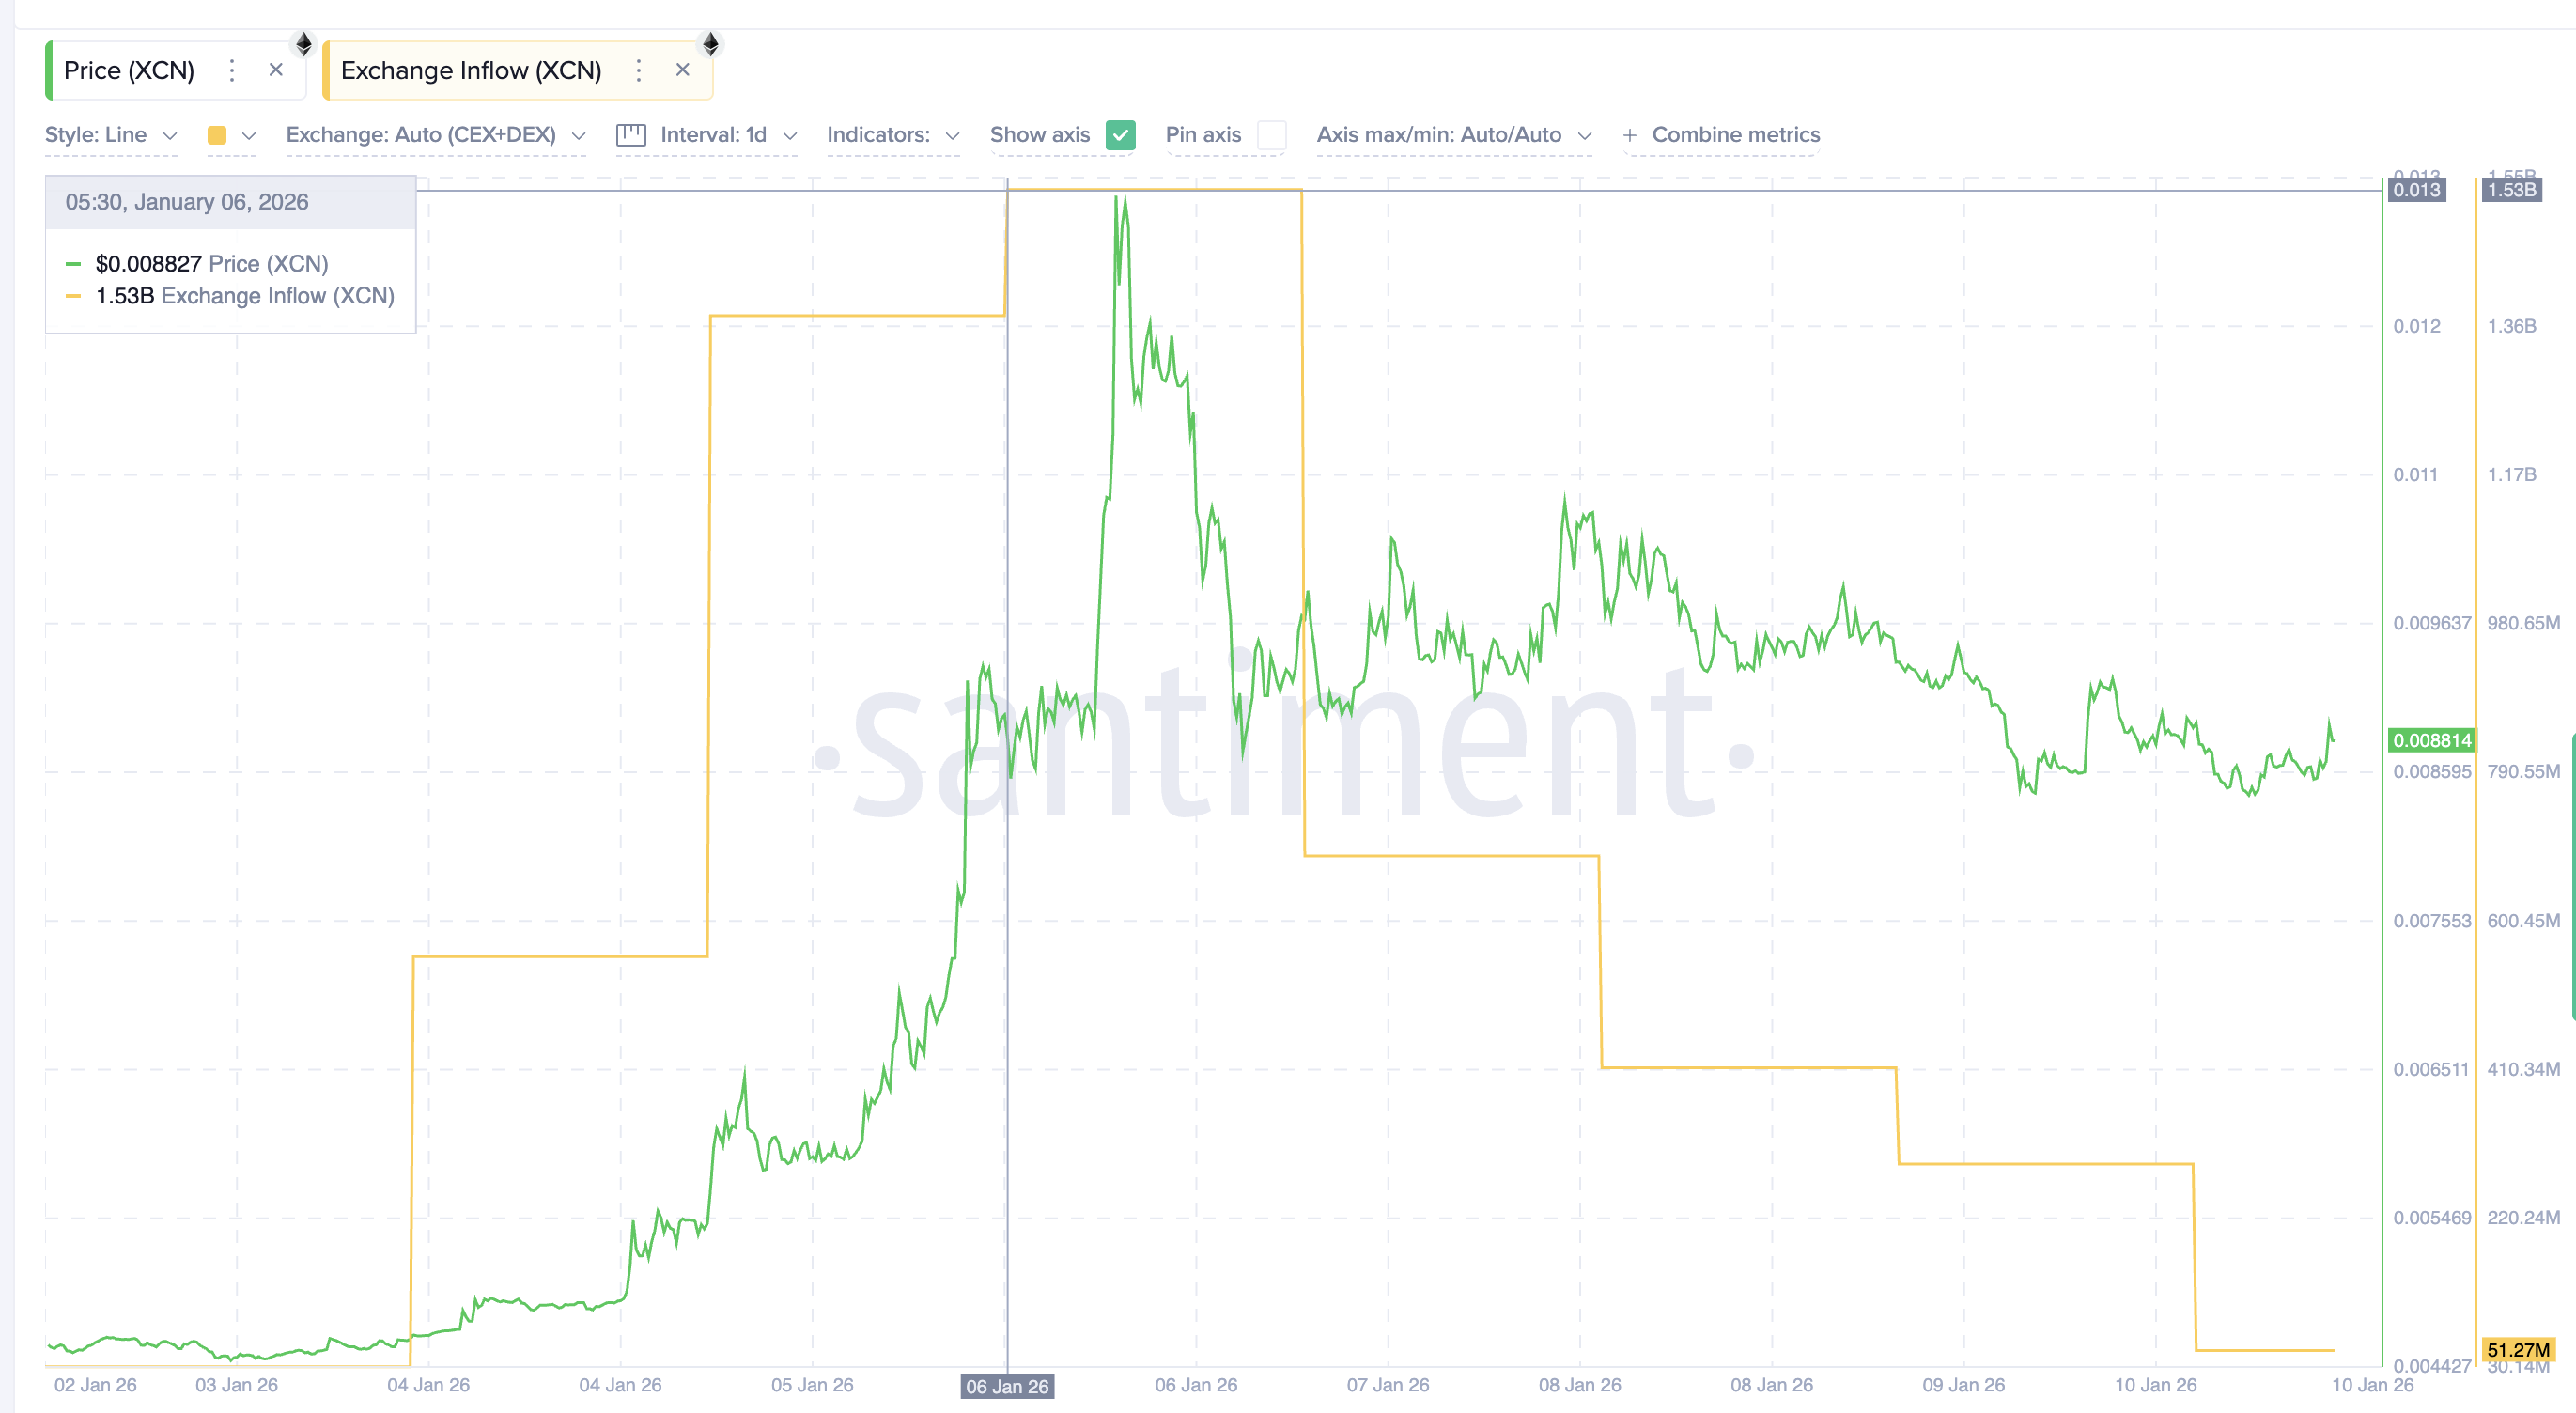
Following the XCN price correction on January 6, whales began accumulating. Wallets holding large Onyxcoin balances increased their combined holdings from roughly 42.26 billion XCN to about 42.55 billion XCN. That is an addition of nearly 290 million XCN tokens during consolidation.

Onyxcoin Whales Buying The Dip
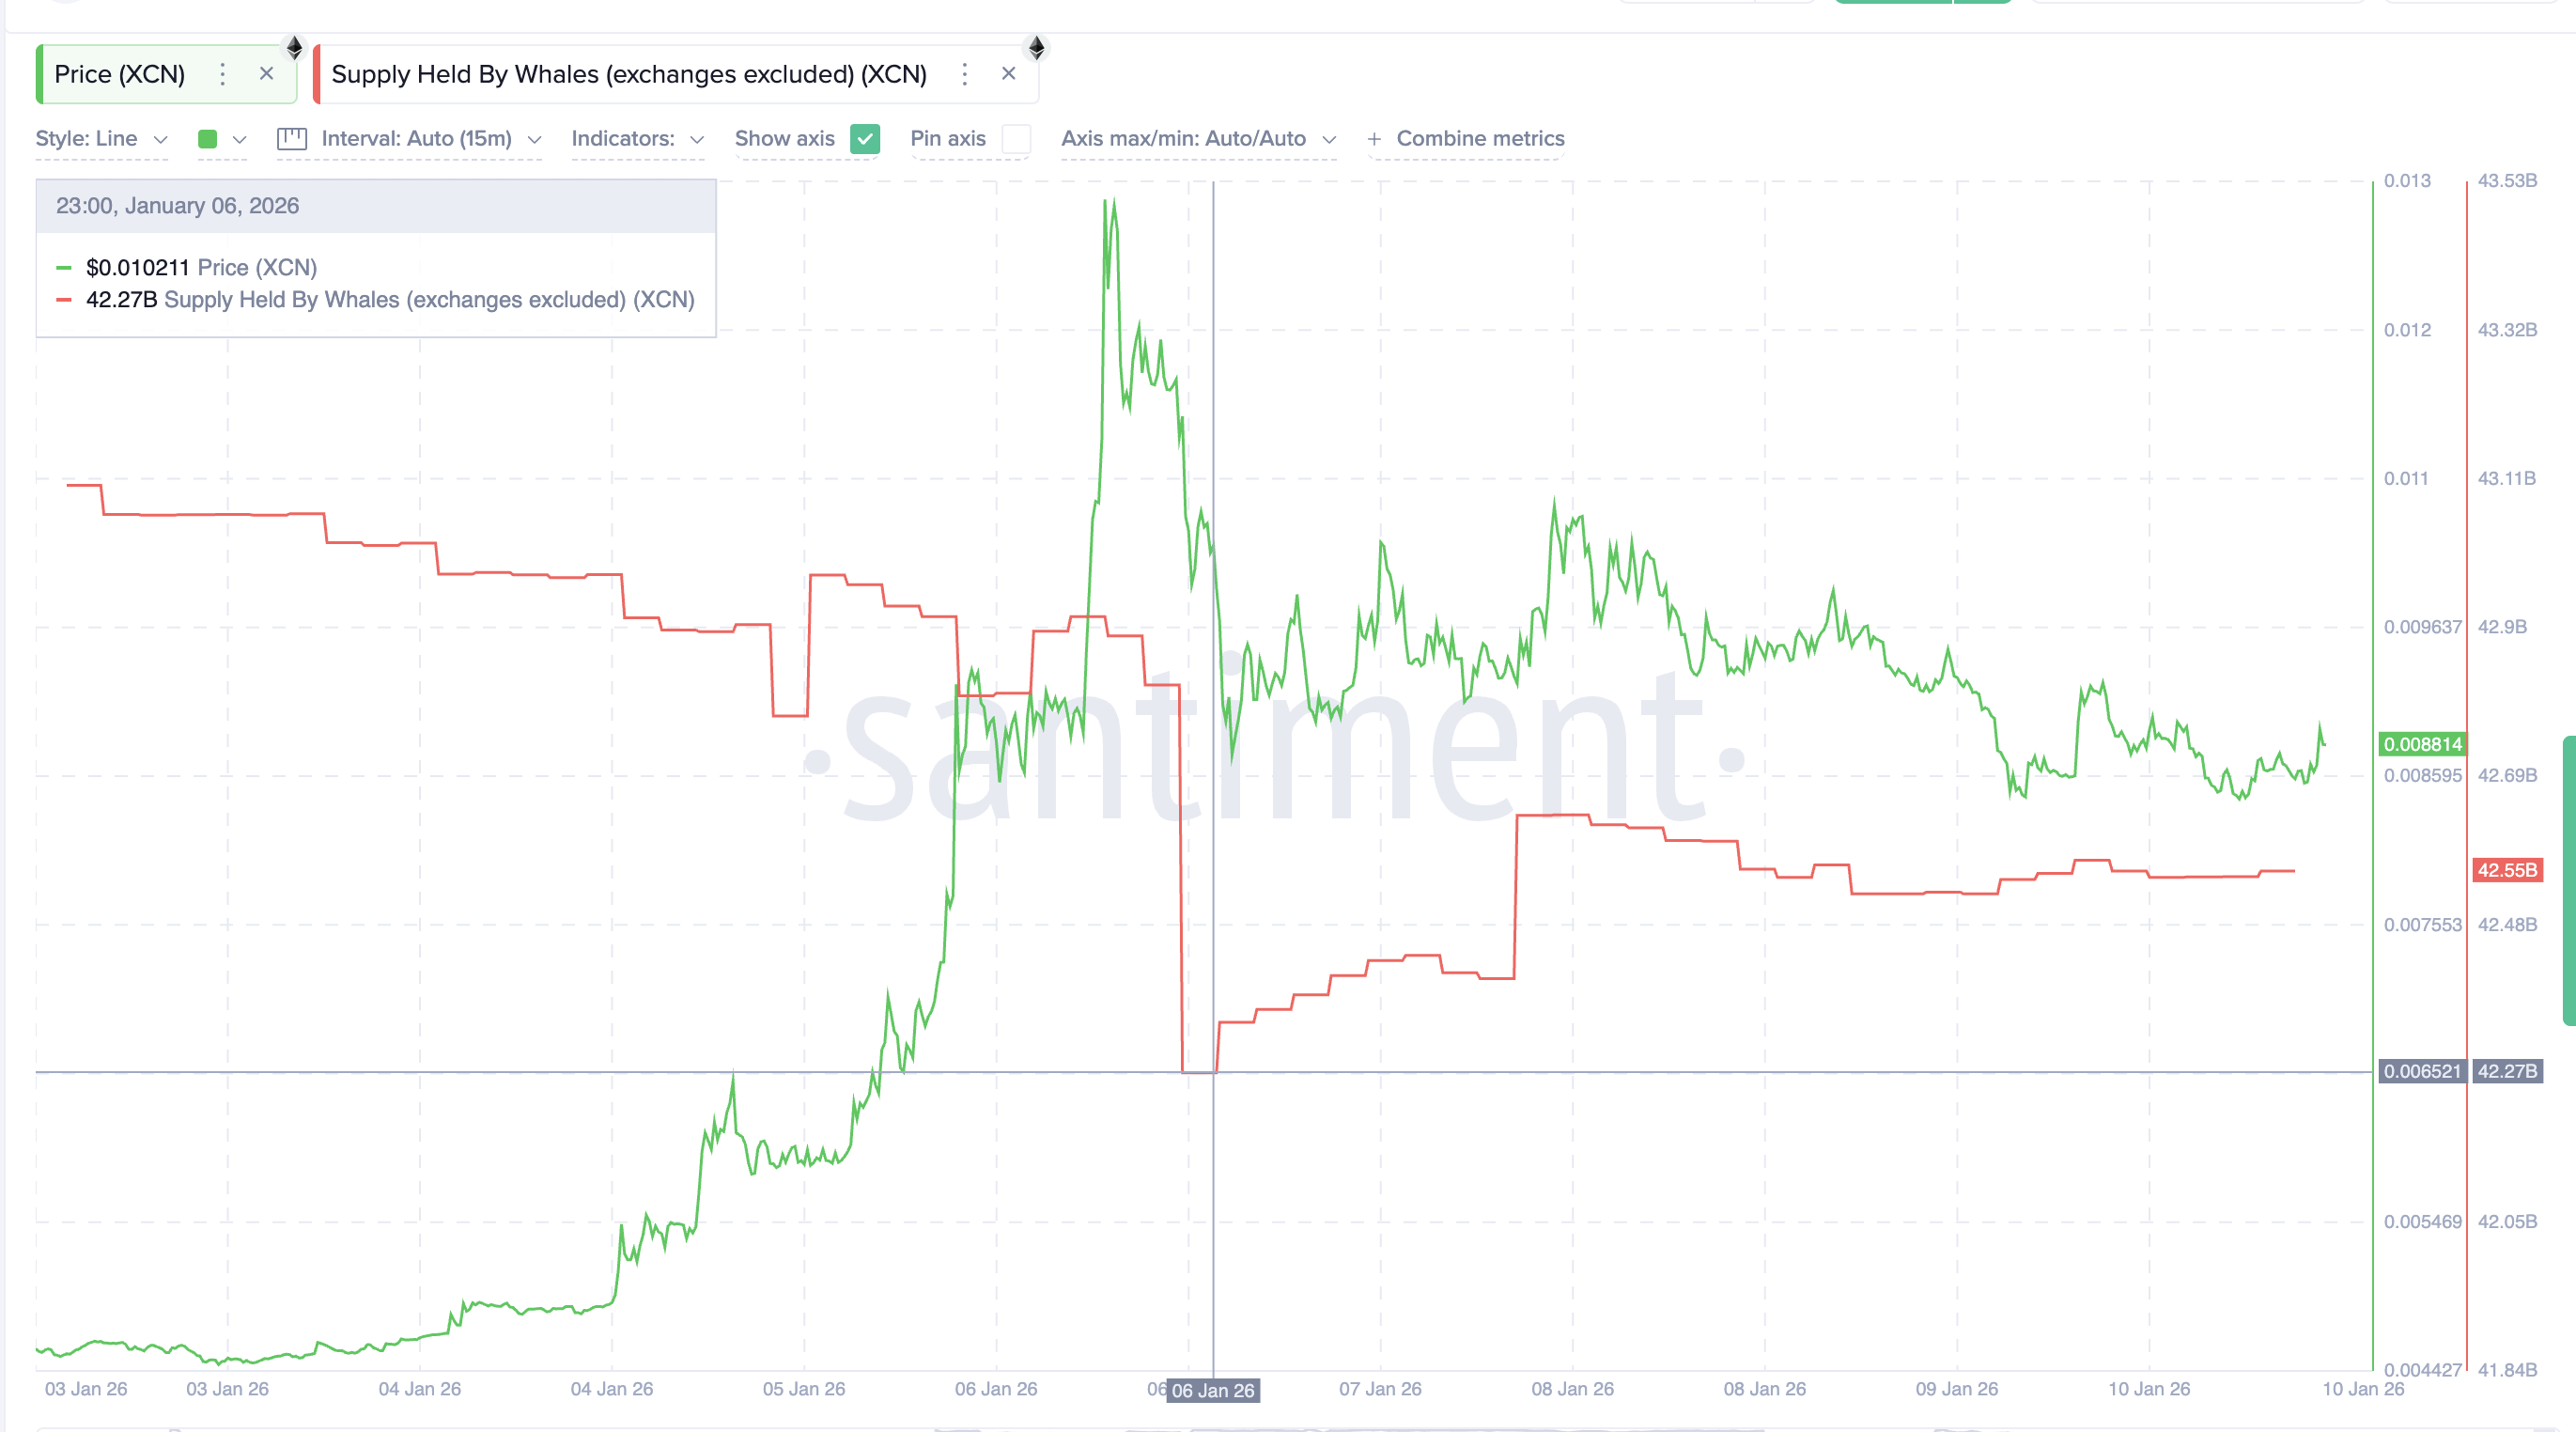
Onyxcoin Whales Buying The Dip: Santiment

At current prices, that accumulation represents roughly $2.6 million in buying pressure. More importantly, it started right as price pulled back, suggesting whales were buying the dip rather than exiting strength.

Exchange data supports this view. Exchange inflows, which track the number of tokens sent to exchanges and often signal selling intent, peaked on January 6. That spike aligned with the price drop. Since then, exchange inflows have collapsed from around 1.53 billion XCN to roughly 51 million XCN, a near 97% dip.

XCN Inflows Slow DownXCN Inflows Slow Down: Santiment

This sharp decline signals that selling pressure has dried up. Fewer coins are moving to exchanges, and more supply is staying off-market. Combined with whale accumulation, this creates a supply-tight environment that favors continuation rather than breakdown.

Key Onyxcoin Price Levels That Decide the Breakout

The first Onyxcoin price level to watch is $0.0090, which aligns closely with the 200-day EMA. Holding above this level keeps the bullish structure intact and increases breakout odds.

The real trigger zone sits near $0.0095. A daily close above this level would confirm a breakout from the upper flag trend line. If that happens, the price could retest $0.0130, the recent local high and first major resistance.

On the downside, $0.0083 is the key support. Losing this level would weaken the flag structure and suggest that consolidation is failing. Below that, $0.0069 becomes critical. A sustained move under this zone would invalidate the bullish setup entirely.

Onyxcoin Price AnalysisOnyxcoin Price Analysis: TradingView

For now, the Onyxcoin remains in balance. The XCN price is consolidating, whales are accumulating, and selling pressure has cooled sharply. Whether this turns into an explosive breakout depends on how the Onyxcoin price reacts around the flag resistance and long-term moving averages.

Market Opportunity
Hive Intelligence Logo
Hive Intelligence Price(HINT)
$0.001876
$0.001876$0.001876
-0.95%
USD
Hive Intelligence (HINT) Live Price Chart
Disclaimer: The articles reposted on this site are sourced from public platforms and are provided for informational purposes only. They do not necessarily reflect the views of MEXC. All rights remain with the original authors. If you believe any content infringes on third-party rights, please contact service@support.mexc.com for removal. MEXC makes no guarantees regarding the accuracy, completeness, or timeliness of the content and is not responsible for any actions taken based on the information provided. The content does not constitute financial, legal, or other professional advice, nor should it be considered a recommendation or endorsement by MEXC.

You May Also Like

[HOMESTRETCH] Beyond the bell: Nesthy Petecio’s becoming

[HOMESTRETCH] Beyond the bell: Nesthy Petecio’s becoming

Despite all her achievements and struggles, the boxer keeps her eyes on an Olympic gold medal
Share
Rappler2026/01/11 18:40
‘Love Island Games’ Season 2 Release Schedule—When Do New Episodes Come Out?

‘Love Island Games’ Season 2 Release Schedule—When Do New Episodes Come Out?

The post ‘Love Island Games’ Season 2 Release Schedule—When Do New Episodes Come Out? appeared on BitcoinEthereumNews.com. LOVE ISLAND GAMES — Episode 201 — Pictured: Ariana Madix — (Photo by: Ben Symons/PEACOCK via Getty Images) Ben Symons/PEACOCK via Getty Images We’ve got a text! It’s time for another season of Love Island Games. With fan-favorites returning in hopes of winning the $250,000 cash prize, read on to learn more about Love Island Games Season 2, including the release schedule so you don’t miss a second of drama. Love Island Games is a spinoff in the Love Island franchise that first premiered in 2023. The show follows a similar format to the original series, but with one major twist: all contestants are returning Islanders from previous seasons of Love Island from around the world, including the USA, UK, Australia and more. Another big difference is that games take on much more importance in Love Island Games than the mothership version, with the results “determining advantages, risks, and even who stays and who goes,” according to Peacock. Vanderpump Rules star Ariana Madix is taking over hosting duties for Love Island Games Season 2, replacing Love Island UK star Maya Jama who hosted the first season. Iain Stirling returns as the show’s narrator, while UK alum Maura Higgins will continue to host the Saturday show Love Island: Aftersun. ForbesWho’s In The ‘Love Island Games’ Season 2 Cast? Meet The IslandersBy Monica Mercuri Jack Fowler and Justine Ndiba were named the first-ever winners of Love Island Games in 2023. Justine had previously won Love Island USA Season 2 with Caleb Corprew, while Jack was a contestant on Love Island UK Season 4. In March 2024, Fowler announced on his Instagram story that he and Justine decided to remain “just friends.” The Season 2 premiere revealed the first couples of the season: Andrea Carmona and Charlie Georgios, Andreina Santos-Marte and Tyrique Hyde,…
Share
BitcoinEthereumNews2025/09/18 04:50
Record instroom Bitcoin-ETF’s – richting $120.000?

Record instroom Bitcoin-ETF’s – richting $120.000?

Connect met Like-minded Crypto Enthusiasts! Connect op Discord! Check onze Discord   De markt voor Bitcoin ETF’s laat wederom een opvallende trend zien. De afgelopen week werd de grootste instroom sinds juli geregistreerd, een ontwikkeling die de aandacht van zowel institutionele als particuliere beleggers trekt. Deze instroom zorgt voor nieuwe speculatie over de vraag of Bitcoin binnenkort de grens van 120.000 dollar kan doorbreken. Laten we dit hieronder nader bekijken. Grootste instroom sinds juli Volgens recente marktgegevens wist de Amerikaanse spot Bitcoin ETF’s een instroom te krijgen ver boven de gemiddelde niveaus van de afgelopen weken. Alleen al op 16 september werd meer dan 290 miljoen dollar netto in deze fondsen gestort. Daarmee markeert dit de zevende opeenvolgende dag met positieve instroom, een duidelijk teken dat institutionele belangstelling opnieuw toeneemt. De grootste bijdrage kwam van BlackRock’s iShares Bitcoin Trust, dat meer dan 200 miljoen dollar stortte. Ook de ETF’s van Fidelity en Ark lieten grote instroom zien. Kortom, de instroom blijft positief. U.S. spot Bitcoin ETFs Ignite with a $553M daily inflow, pushing a four-day streak to $1.7B. Ether ETFs also saw a resurgence with $113M in new funds. #Bitcoin #ETF #ETHhttps://t.co/zZiNqtKSEm — Cryptonews.com (@cryptonews) September 12, 2025 Hoe instroom prijsondersteuning biedt De sterke instroom in Bitcoin ETF’s is meer dan een mijlpaal. Het laat zien hoe de vraag naar Bitcoin groeit vanuit institutionele hoek en dat deze vraag niet voor een keer is, maar structureel is. Omdat de instroom de hoeveelheid nieuw geminde Bitcoin overtreft, ontstaat er een overschot qua vraag dat de prijs positief kan beïnvloeden. Dit verschil tussen aanbod en vraag zorgt ervoor dat het dalende risico wordt beperkt. Wanneer institutionele beleggers via ETF’s posities opbouwen, gebeurt dit bovendien vaak met een langere beleggingshorizon. Dat geeft de markt extra stabiliteit, zeker in een periode waarin onzekerheden rondom rente en macro-economie nog altijd spelen. Signaalfunctie voor beleggers Voor beleggers in de crypto markt hebben deze cijfers een signaalfunctie. Het vertrouwen dat grote institutionele spelers door miljarden te alloceren in gereguleerde beleggingsproducten bevestigt dat Bitcoin steeds meer gekocht wordt in de traditionele financiële wereld. Dit momentum werkt vaak door naar de bredere markt, omdat particuliere beleggers dit zien als bevestiging dat de trend omhoog sterker wordt. Ook technische analyse wijst op een belangrijke fase. De koers van Bitcoin beweegt rond de 118.000 dollar, een weerstandsniveau dat al meerdere keren is getest. Het momentum dat voortkomt uit de ETF instroom kan de kracht geven om dit niveau te doorbreken en een nieuwe fase van prijsstijging richting 120.000 dollar in te luiden. Op korte termijn richting de $120.000? Hoewel niemand met zekerheid kan voorspellen of Bitcoin dit niveau direct zal bereiken, biedt de huidige context sterke aanwijzingen dat de kans aanwezig is. De combinatie van record instroom, institutioneel vertrouwen en een gunstig technisch analyse vormt een krachtige mix. Beleggers doen er goed aan om rekening te houden met de invloed van externe factoren zoals beleidsbesluiten van de Federal Reserve. Best wallet - betrouwbare en anonieme wallet Best wallet - betrouwbare en anonieme wallet Meer dan 60 chains beschikbaar voor alle crypto Vroege toegang tot nieuwe projecten Hoge staking belongingen Lage transactiekosten Best wallet review Koop nu via Best Wallet Let op: cryptocurrency is een zeer volatiele en ongereguleerde investering. Doe je eigen onderzoek.   Het bericht Record instroom Bitcoin-ETF’s – richting $120.000? is geschreven door Timo Bruinsel en verscheen als eerst op Bitcoinmagazine.nl.
Share
Coinstats2025/09/18 01:31