XRP price started a fresh decline below $2.150. The price is now attempting to recover and faces resistance near the $2.15 pivot level. XRP price started a fresh decline below the $2.10 zone. The price is now trading below $2.150 and the 100-hourly Simple Moving Average. There is a bearish trend line forming with resistance at $2.150 on the hourly chart of the XRP/USD pair (data source from Kraken). The pair could continue to move down if it settles below $2.020. XRP Price Faces Resistance XRP price attempted a recovery wave above $2.20 but failed to continue higher, like Bitcoin and Ethereum. The price started a fresh decline below $2.150 and $2.120. There was a move below the $2.050 support level. A low was formed at $2.025, and the price is now attempting a recovery wave. There was a move toward the 23.6% Fib retracement level of the downward move from the $2.525 swing high to the $2.025 low. The price is now trading below $2.150 and the 100-hourly Simple Moving Average. If there is a fresh upward move, the price might face resistance near the $2.140 level. There is also a bearish trend line forming with resistance at $2.150 on the hourly chart of the XRP/USD pair. The first major resistance is near the $2.20 level. A close above $2.20 could send the price to $2.250. The next hurdle sits at $2.2750 or the 50% Fib retracement level of the downward move from the $2.525 swing high to the $2.025 low. A clear move above the $2.2750 resistance might send the price toward the $2.320 resistance. Any more gains might send the price toward the $2.350 resistance. The next major hurdle for the bulls might be near $2.420. Another Drop? If XRP fails to clear the $2.150 resistance zone, it could start a fresh decline. Initial support on the downside is near the $2.050 level. The next major support is near the $2.020 level. If there is a downside break and a close below the $2.020 level, the price might continue to decline toward $1.9650. The next major support sits near the $1.920 zone, below which the price could continue lower toward $1.880. Technical Indicators Hourly MACD – The MACD for XRP/USD is now losing pace in the bearish zone. Hourly RSI (Relative Strength Index) – The RSI for XRP/USD is now above the 50 level. Major Support Levels – $2.050 and $2.020. Major Resistance Levels – $2.150 and $2.250.XRP price started a fresh decline below $2.150. The price is now attempting to recover and faces resistance near the $2.15 pivot level. XRP price started a fresh decline below the $2.10 zone. The price is now trading below $2.150 and the 100-hourly Simple Moving Average. There is a bearish trend line forming with resistance at $2.150 on the hourly chart of the XRP/USD pair (data source from Kraken). The pair could continue to move down if it settles below $2.020. XRP Price Faces Resistance XRP price attempted a recovery wave above $2.20 but failed to continue higher, like Bitcoin and Ethereum. The price started a fresh decline below $2.150 and $2.120. There was a move below the $2.050 support level. A low was formed at $2.025, and the price is now attempting a recovery wave. There was a move toward the 23.6% Fib retracement level of the downward move from the $2.525 swing high to the $2.025 low. The price is now trading below $2.150 and the 100-hourly Simple Moving Average. If there is a fresh upward move, the price might face resistance near the $2.140 level. There is also a bearish trend line forming with resistance at $2.150 on the hourly chart of the XRP/USD pair. The first major resistance is near the $2.20 level. A close above $2.20 could send the price to $2.250. The next hurdle sits at $2.2750 or the 50% Fib retracement level of the downward move from the $2.525 swing high to the $2.025 low. A clear move above the $2.2750 resistance might send the price toward the $2.320 resistance. Any more gains might send the price toward the $2.350 resistance. The next major hurdle for the bulls might be near $2.420. Another Drop? If XRP fails to clear the $2.150 resistance zone, it could start a fresh decline. Initial support on the downside is near the $2.050 level. The next major support is near the $2.020 level. If there is a downside break and a close below the $2.020 level, the price might continue to decline toward $1.9650. The next major support sits near the $1.920 zone, below which the price could continue lower toward $1.880. Technical Indicators Hourly MACD – The MACD for XRP/USD is now losing pace in the bearish zone. Hourly RSI (Relative Strength Index) – The RSI for XRP/USD is now above the 50 level. Major Support Levels – $2.050 and $2.020. Major Resistance Levels – $2.150 and $2.250.

XRP Price Weakens Again, Key Demand Area Tested After Steady Downmove

2025/11/20 12:08

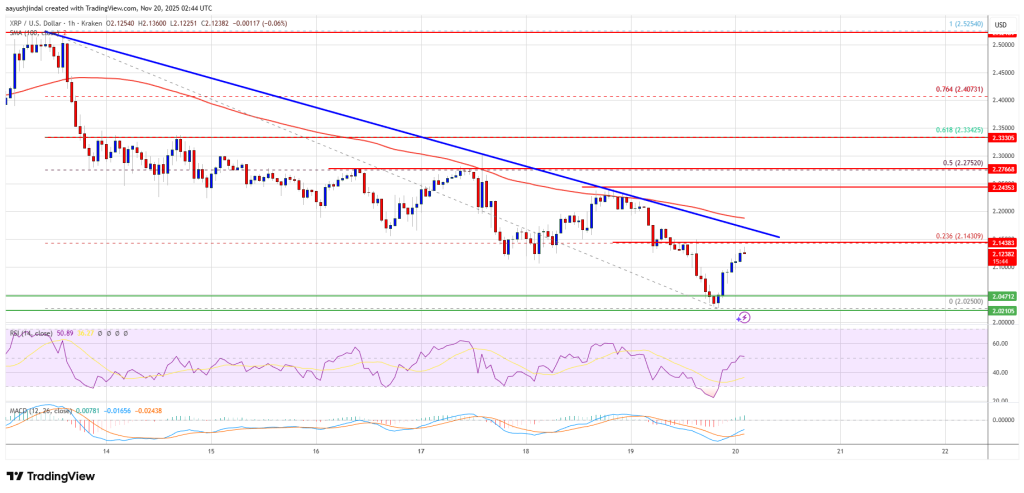
XRP price started a fresh decline below $2.150. The price is now attempting to recover and faces resistance near the $2.15 pivot level.

  • XRP price started a fresh decline below the $2.10 zone.
  • The price is now trading below $2.150 and the 100-hourly Simple Moving Average.
  • There is a bearish trend line forming with resistance at $2.150 on the hourly chart of the XRP/USD pair (data source from Kraken).
  • The pair could continue to move down if it settles below $2.020.

XRP Price Faces Resistance

XRP price attempted a recovery wave above $2.20 but failed to continue higher, like Bitcoin and Ethereum. The price started a fresh decline below $2.150 and $2.120.

There was a move below the $2.050 support level. A low was formed at $2.025, and the price is now attempting a recovery wave. There was a move toward the 23.6% Fib retracement level of the downward move from the $2.525 swing high to the $2.025 low.

The price is now trading below $2.150 and the 100-hourly Simple Moving Average. If there is a fresh upward move, the price might face resistance near the $2.140 level. There is also a bearish trend line forming with resistance at $2.150 on the hourly chart of the XRP/USD pair.
XRP Price

The first major resistance is near the $2.20 level. A close above $2.20 could send the price to $2.250. The next hurdle sits at $2.2750 or the 50% Fib retracement level of the downward move from the $2.525 swing high to the $2.025 low. A clear move above the $2.2750 resistance might send the price toward the $2.320 resistance. Any more gains might send the price toward the $2.350 resistance. The next major hurdle for the bulls might be near $2.420.

Another Drop?

If XRP fails to clear the $2.150 resistance zone, it could start a fresh decline. Initial support on the downside is near the $2.050 level. The next major support is near the $2.020 level.

If there is a downside break and a close below the $2.020 level, the price might continue to decline toward $1.9650. The next major support sits near the $1.920 zone, below which the price could continue lower toward $1.880.

Technical Indicators

Hourly MACD – The MACD for XRP/USD is now losing pace in the bearish zone.

Hourly RSI (Relative Strength Index) – The RSI for XRP/USD is now above the 50 level.

Major Support Levels – $2.050 and $2.020.

Major Resistance Levels – $2.150 and $2.250.

Disclaimer: The articles reposted on this site are sourced from public platforms and are provided for informational purposes only. They do not necessarily reflect the views of MEXC. All rights remain with the original authors. If you believe any content infringes on third-party rights, please contact service@support.mexc.com for removal. MEXC makes no guarantees regarding the accuracy, completeness, or timeliness of the content and is not responsible for any actions taken based on the information provided. The content does not constitute financial, legal, or other professional advice, nor should it be considered a recommendation or endorsement by MEXC.

You May Also Like

Latin America’s Crypto Adoption Breakthrough: 116% Growth in 2024 and 57 Million Users Fueled by Regulation

Latin America’s Crypto Adoption Breakthrough: 116% Growth in 2024 and 57 Million Users Fueled by Regulation

The post Latin America’s Crypto Adoption Breakthrough: 116% Growth in 2024 and 57 Million Users Fueled by Regulation appeared on BitcoinEthereumNews.com. According to a Bitso-compiled dataset and corroborating Coinchange Regulatory Report, Latin America is entering a notable year for cryptocurrency adoption, with 2024 showing a 116% growth and the first half of 2025 adding another 65% surge, lifting regional users beyond 57 million. The momentum reflects a shift toward institutional-grade activity and a more resilient market structure as digital assets gain mainstream traction. A steadier regulatory environment, coupled with market maturation and targeted policy steps in major markets, has underpinned this expansion. Regional leaders cite reforms such as Brazil’s 2022 Law No. 14,478 establishing a crypto framework, the 2023 FinTech Law in Chile, and Mexico’s 2018 FinTech Law as foundational pillars that enable safer access to digital assets. Industry observers argue that Latin America is increasingly poised to become a strategic hub for global financial innovation and digital asset solutions, with Bitso’s ongoing regulatory dialogue viewed as critical to balancing innovation with consumer protection in the evolving crypto landscape. Source: https://en.coinotag.com/breakingnews/latin-americas-crypto-adoption-breakthrough-116-growth-in-2024-and-57-million-users-fueled-by-regulation
Share
BitcoinEthereumNews2025/11/20 13:40