Hyperliquid price gained 5% as Hypurr NFTs launched, with rising trading activity and key resistance at $50 now in focus. Hyperliquid (HYPE) is trading at $47.23 at press time, up 5% in the past 24 hours. The move comes after…Hyperliquid price gained 5% as Hypurr NFTs launched, with rising trading activity and key resistance at $50 now in focus. Hyperliquid (HYPE) is trading at $47.23 at press time, up 5% in the past 24 hours. The move comes after…

Hyperliquid price rallies back towards $50 as Hyperr NFTs debut

2025/09/29 14:32
3 min read

Hyperliquid price gained 5% as Hypurr NFTs launched, with rising trading activity and key resistance at $50 now in focus.

Summary
  • HYPE trades near $47, up 5% in 24 hours.
  • Hypurr NFTs debut, floor price hits $68K.
  • $50 resistance is key, $44 remains strong support.

Hyperliquid (HYPE) is trading at $47.23 at press time, up 5% in the past 24 hours. The move comes after a week of mixed trading, with prices dipping as low as $43 before recovering toward the $50 mark. Over the past 30 days, HYPE is still up 7%, though it remains 20% below its all-time high of $59.30, set on Sept. 18.

Daily trading volume has risen 11% to $522 million, showing more activity among traders. According to CoinGlass data, Hyperliquid (HYPE) futures volume climbed 13.85% to $1.8 billion, while open interest edged up only 0.61% to $2.28 billion. 

This pattern means more contracts are changing hands, but traders are not committing heavily to long-term positions. In practice, it reflects short-term trading interest rather than aggressive directional bets.

Hypurr NFTs spark new ecosystem activity

On Sept. 28, the Hyperliquid Foundation launched Hypurr NFTs, a collection of 4,600 cat-themed digital collectibles deployed directly on the HyperEVM. Most of these NFTs, 4,313 in total, were distributed to early users from the Genesis Event in November 2024. The rest went to the Foundation, Hyperliquid Labs, NFT artists, and other contributors.

Unlike standard NFT drops, Hypurr was designed as a memento for early supporters and is tightly linked to Hyperliquid’s infrastructure. Built on HyperEVM, the NFTs connect to the same liquidity that powers the chain’s trading layer. This design makes them more than art. Developers can build apps around them using HyperCore liquidity and HyperBFT consensus.

Market reception has been strong. The collection surfaced on OpenSea with floor prices of about 1,458 HYPE (roughly $68,700). Shortly after launch, one NFT even sold for over $467,000, igniting community discussion. Notably, security researcher ZachXBT reported a theft of eight NFTs, worth about $400,000, reminding holders of the importance of wallet security.

This blend of technological innovation, high-value transactions, and culture has brought Hyperliquid and its ecosystem new attention.

Hyperliquid price technical analysis

According to the charts, HYPE is trading between $44 and $47, with $44 serving as a solid support level. Since the recent pullback, upward movements have been capped by resistance at $50.

Hyperliquid price rallies back towards $50 as Hyperr NFTs debut - 1

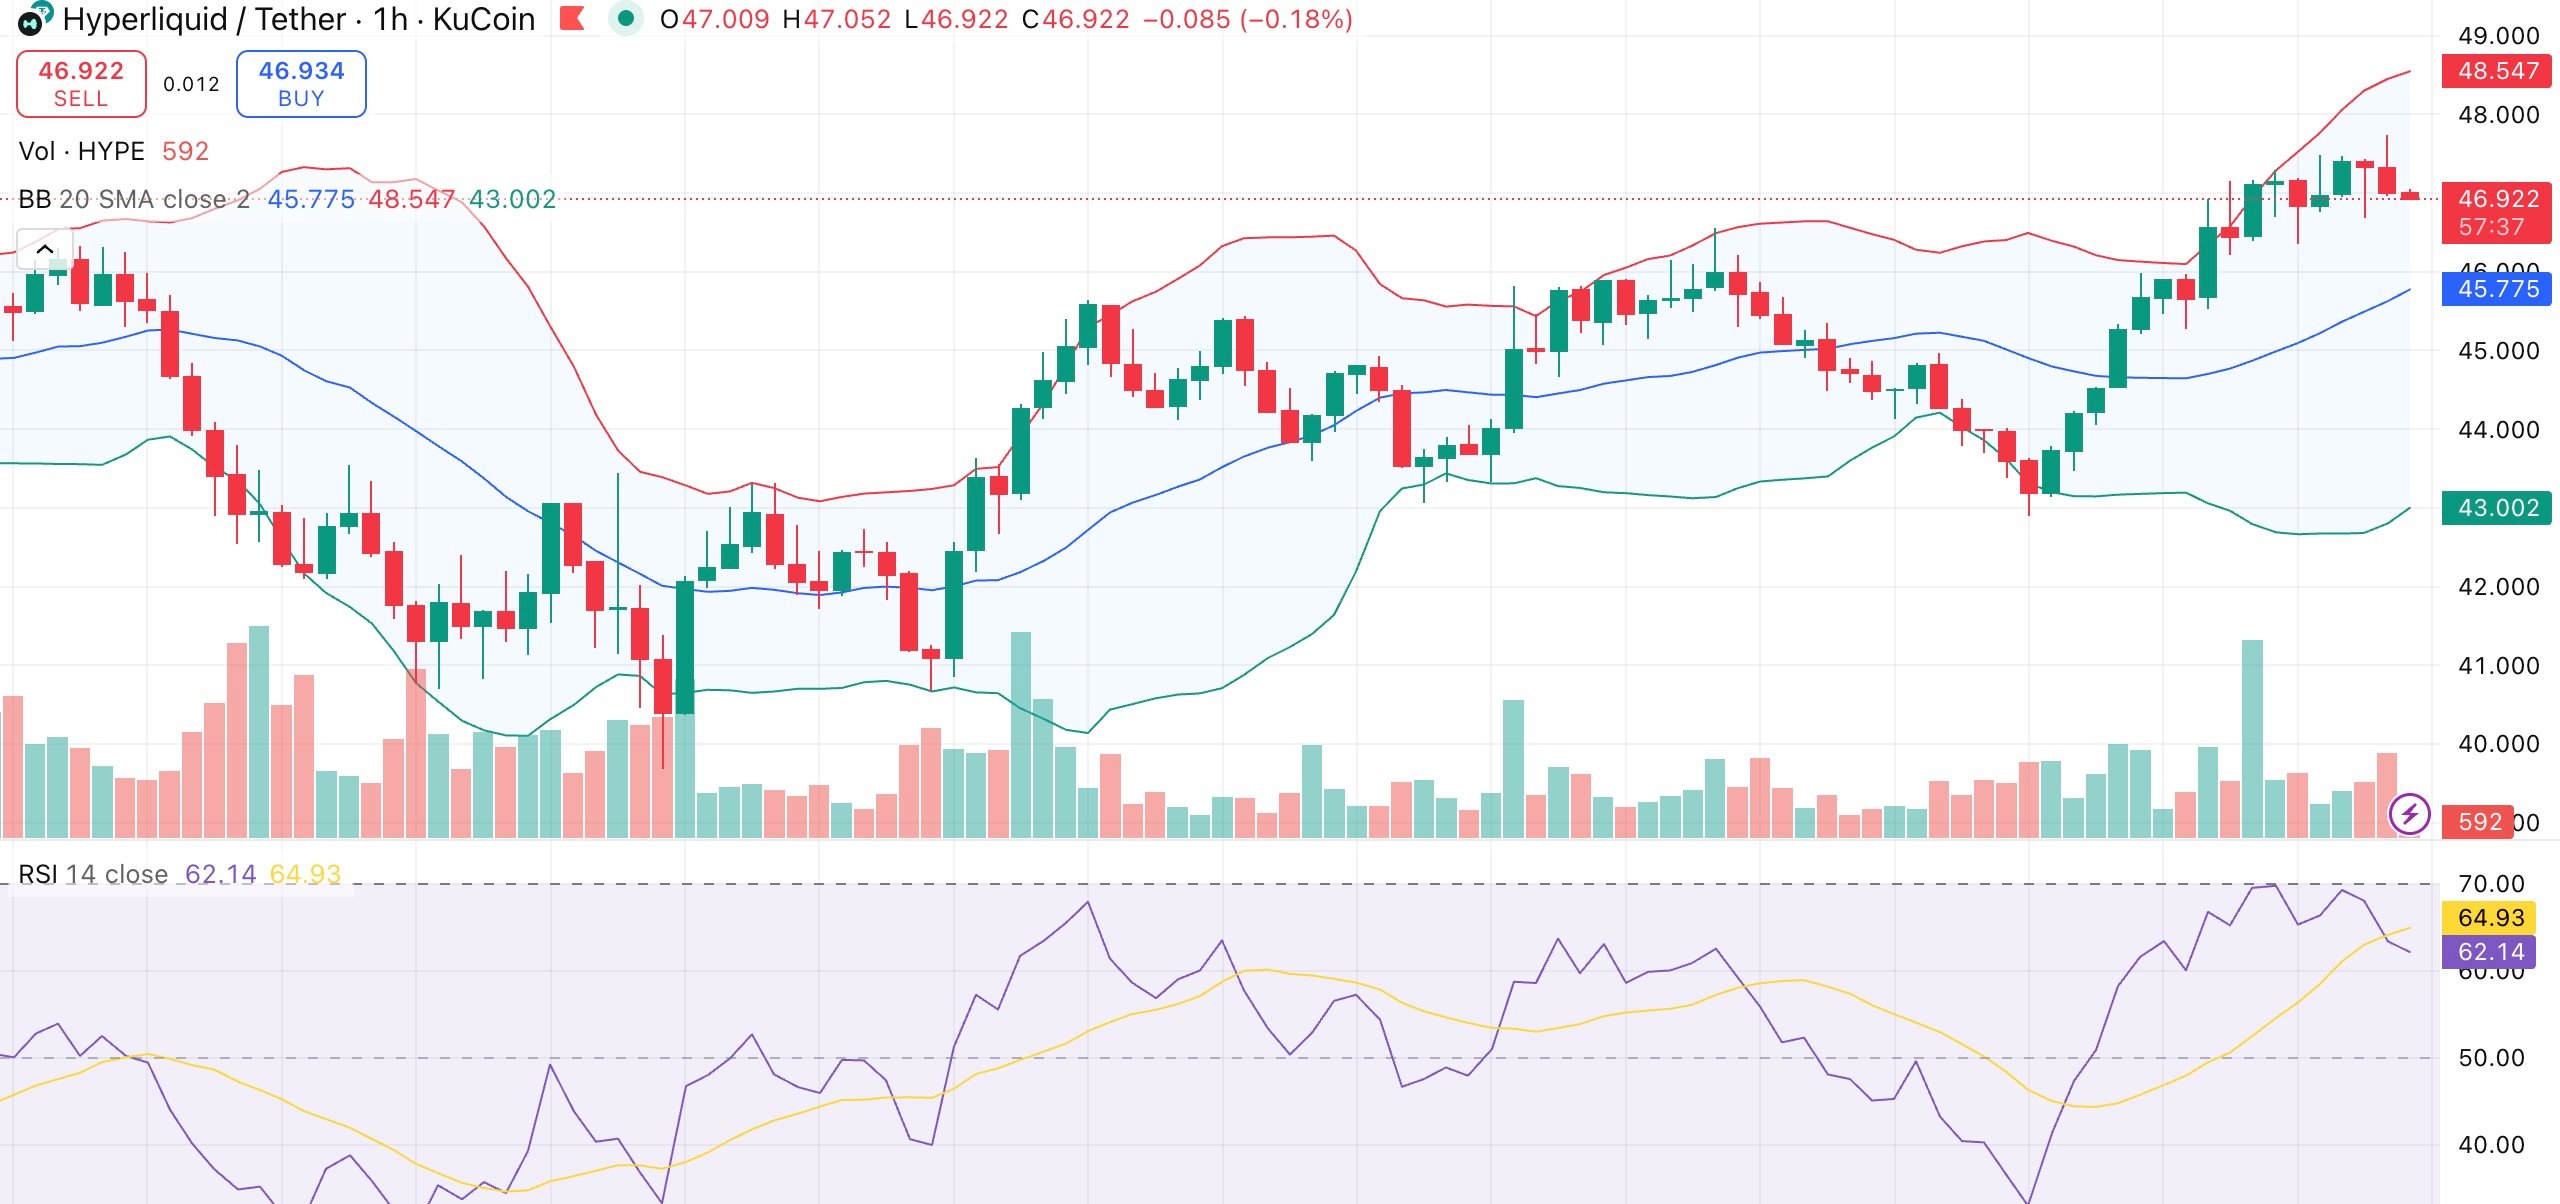
With a relative strength index of 46, neutral momentum is suggested. The MACD is still negative, suggesting some bearish pressure. Bollinger Bands are tightening, often a sign that a sharp move may be coming.

In the short term, moving averages are bearish as the 10-, 20-, and 50-day EMAs indicate selling pressure. The 100- and 200-day averages, however, continue to be supportive, indicating that the overall trend is still in place.

If HYPE clears $50 with strong volume, it could retest $59, the September high. But if it loses $44, the price may slide back towards the $30 region. For now, NFT-driven demand is giving bulls a case, while technical levels mark the next decisive tests.

Market Opportunity
Hyperliquid Logo
Hyperliquid Price(HYPE)
$31.38
$31.38$31.38
-0.57%
USD
Hyperliquid (HYPE) Live Price Chart
Disclaimer: The articles reposted on this site are sourced from public platforms and are provided for informational purposes only. They do not necessarily reflect the views of MEXC. All rights remain with the original authors. If you believe any content infringes on third-party rights, please contact service@support.mexc.com for removal. MEXC makes no guarantees regarding the accuracy, completeness, or timeliness of the content and is not responsible for any actions taken based on the information provided. The content does not constitute financial, legal, or other professional advice, nor should it be considered a recommendation or endorsement by MEXC.

You May Also Like

Microsoft Corp. $MSFT blue box area offers a buying opportunity

Microsoft Corp. $MSFT blue box area offers a buying opportunity

The post Microsoft Corp. $MSFT blue box area offers a buying opportunity appeared on BitcoinEthereumNews.com. In today’s article, we’ll examine the recent performance of Microsoft Corp. ($MSFT) through the lens of Elliott Wave Theory. We’ll review how the rally from the April 07, 2025 low unfolded as a 5-wave impulse followed by a 3-swing correction (ABC) and discuss our forecast for the next move. Let’s dive into the structure and expectations for this stock. Five wave impulse structure + ABC + WXY correction $MSFT 8H Elliott Wave chart 9.04.2025 In the 8-hour Elliott Wave count from Sep 04, 2025, we saw that $MSFT completed a 5-wave impulsive cycle at red III. As expected, this initial wave prompted a pullback. We anticipated this pullback to unfold in 3 swings and find buyers in the equal legs area between $497.02 and $471.06 This setup aligns with a typical Elliott Wave correction pattern (ABC), in which the market pauses briefly before resuming its primary trend. $MSFT 8H Elliott Wave chart 7.14.2025 The update, 10 days later, shows the stock finding support from the equal legs area as predicted allowing traders to get risk free. The stock is expected to bounce towards 525 – 532 before deciding if the bounce is a connector or the next leg higher. A break into new ATHs will confirm the latter and can see it trade higher towards 570 – 593 area. Until then, traders should get risk free and protect their capital in case of a WXY double correction. Conclusion In conclusion, our Elliott Wave analysis of Microsoft Corp. ($MSFT) suggested that it remains supported against April 07, 2025 lows and bounce from the blue box area. In the meantime, keep an eye out for any corrective pullbacks that may offer entry opportunities. By applying Elliott Wave Theory, traders can better anticipate the structure of upcoming moves and enhance risk management in volatile markets. Source: https://www.fxstreet.com/news/microsoft-corp-msft-blue-box-area-offers-a-buying-opportunity-202509171323
Share
BitcoinEthereumNews2025/09/18 03:50
TON Technical Analysis Feb 14

TON Technical Analysis Feb 14

The post TON Technical Analysis Feb 14 appeared on BitcoinEthereumNews.com. Although TON’s market structure is in a general downtrend, it shows recovery above the
Share
BitcoinEthereumNews2026/02/14 13:20
Trump Media and Technology Group Files New Crypto ETFs After SEC Delay

Trump Media and Technology Group Files New Crypto ETFs After SEC Delay

TLDR Trump Media refiles Bitcoin Ethereum and Cronos ETFs after SEC delay Crypto.com and Yorkville will advise and manage the new Truth Social ETFs ETFs will include
Share
Coincentral2026/02/14 13:31