Bitcoin On‑Chain Data Just Flashed a Red Flag – A Clear Top Signal
The BTC price may be heading into a tricky phase, and the latest on-chain data is giving traders a reason to pause. Over the weekend, Bitcoin recorded a profit-to-loss transaction ratio of 2.95. Put simply, for every transaction happening at a loss, nearly three are happening in profit.
At first, that sounds like a good thing. Plenty of traders are in profit, activity is strong, and the market looks active. But here’s the catch, this kind of setup has shown up before, and it often comes right before the BTC price cools off.
Why Traders Pay Attention to This Ratio
The metric shared by Santiment gives a clear view of how much Bitcoin is being moved at a profit compared to a loss. When the ratio climbs this high, it usually means a lot of holders are deciding to take profits. And when many participants start locking in gains at the same time, it can create pressure on the market.
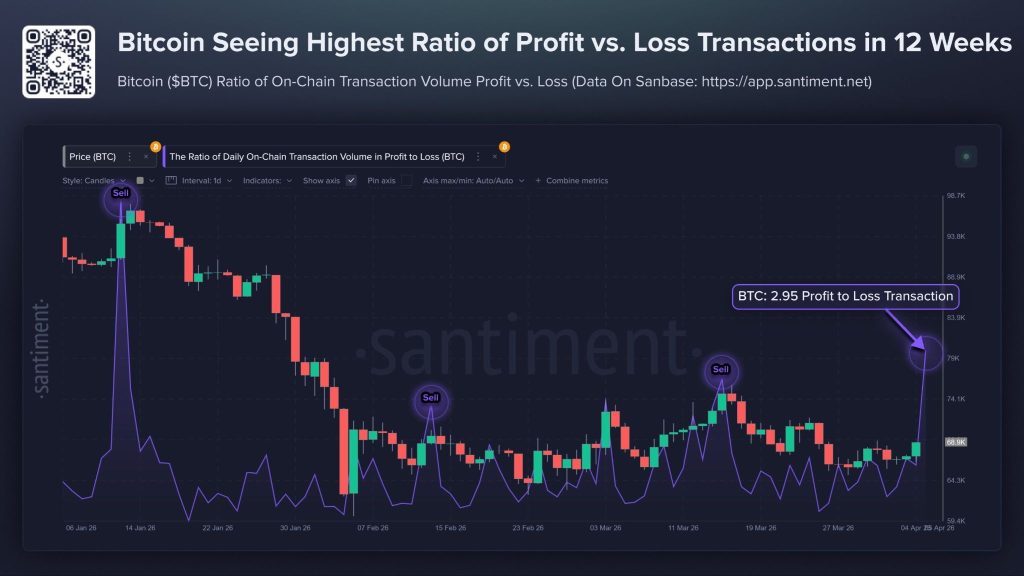 Source: X/@santimentfeed
If you look back, the pattern is hard to ignore. In mid-January, the ratio jumped as the BTC price traded close to $98,700, and the market dropped soon after. The same thing played out again in early February near $74,000, and once more in March around $79,000. Each time, a spike in this ratio came before the BTC price moved lower.
Now here we are again. The ratio is sitting at a 12-week high of 2.95, with the BTC price around $68,900. That puts the market in a familiar spot where profit-taking starts picking up and traders become more careful.
Read Also: ChatGPT Predicts the Price of XRP and Bitcoin If the US and Iran Agree to a Ceasefire by the End of April
Why This Bitcoin Situation Isn’t Exactly the Same
Even though the pattern looks familiar, there’s one detail that stands out. The earlier spikes happened when the BTC price was much higher. Back then, the market was closer to its recent peaks. This time, the price is noticeably lower.
That changes the conversation a bit. Instead of late buyers exiting near the top, this activity could be coming from holders who bought much earlier. These are people still sitting on solid profits, even at current levels, and they’re simply cashing in some gains.
That kind of selling doesn’t always hit the market the same way. It can be part of a normal cycle where profits are taken without weakening the overall structure of Bitcoin.
What Traders Are Watching Right Now
So the big question is simple: does the BTC price follow the same pattern again? If it does, this spike in the ratio could lead to another short-term dip. That’s why many traders are watching closely to see if selling pressure starts to increase over the next few days.
At the same time, there’s another possibility. The market could absorb this wave of profit-taking without breaking down. If the BTC price holds steady and the ratio starts to ease, it would break the pattern seen in previous cases. That would point to a stronger market underneath the surface.
Right now, the BTC price is at a point where both caution and optimism are in play. The data is raising a red flag that has worked well in the past, but the setup isn’t exactly identical this time.
For traders and investors, this is one of those moments where it makes sense to stay alert. The next move should give a clearer picture of whether this signal is pointing to another short-term top or simply showing healthy profit-taking in a market that still has solid support underneath.
Subscribe to our YouTube channel for daily crypto updates, market insights, and expert analysis.
The post Bitcoin On‑Chain Data Just Flashed a Red Flag – A Clear Top Signal appeared first on CaptainAltcoin.


You May Also Like

OpenAI Calls for Global Shift in Taxation, Labor Policy as AI Takes Over

Oklo (OKLO) Stock: Top Execs Dump $21M in Shares Amid Cramer Criticism and Earnings Disappointment