

Fed Pauses Interest Rate Cuts as Bitcoin Falls Below $88K
Bitcoin pared some gains after the Federal Reserve kept interest rates steady as widely expected, retreating from the $90,000 mark after reclaiming it for the first time since last Friday, and dropping below $88,000.
The world’s largest cryptocurrency by market capitalization was down 1.2% in the last 24 hours, trading at $87,862 as of 03:53 a.m. EST, with a 13% jump in trading activity and trading volume soaring to $49.7 billion.
The drop came amid a 1.1% decline in crypto market capitalization to $3.06 trillion.
As a result of the sudden move, total liquidations totaled $345.63 million, with BTC longs at $112.36 million, according to Coinglass data.
Fed Pauses Interest Rate Cuts
The United States Federal Reserve left interest rates unchanged this month, keeping them at 3.50%-3.75% following the latest Fed meeting, which concluded on Wednesday. In December, the Fed cut interest rates by 25 basis points.
Fed officials recommended a wait-and-see approach given sticky inflation and a tight labor market. In most cases, higher interest rates increase the opportunity cost of holding yield-bearing assets such as U.S. Treasury securities.
This, in turn, reduces the appeal of risk-on assets such as Bitcoin and equities, which appears to be the case over the past 24 hours.
On the other hand, lower interest rates typically support non-yielding assets such as Bitcoin by reducing the opportunity cost of holding them.
Futures contracts for the S&P 500 Index, for instance, dipped by as much as 0.52% on Jan. 29, mirroring Bitcoin’s decline on the same day.
Geopolitics Adds To The Risk-Off Mood, As Investors Turn To Safe-Haven Assets
Tensions between the US and Iran escalated this week, after the US President Donald Trump told Tehran time was running out and that a huge armada was moving quickly towards the country “with great power, enthusiasm and purpose”.
It was the starkest indication yet from Trump that he intends to mount some kind of military strike imminently if Iran refuses to negotiate a deal on the future of its nuclear programme.
Bitcoin Price Still in an Indecision Phase
After reaching the $126,200 all-time high in early October, the Bitcoin price fell into a sustained decline, reaching the long-term support area around $80,629. This level then became a strong demand area, pushing the price up to a recovery around the $95,500 level.
This area now acts as a strong barrier to the upside, serving as a cushion against downward pressure, with the BTC price now held within a sideways pattern.
After hitting the $97,808 resistance on January 14, Bitcoin pulled back, with the 0.618 Fibonacci level ($86,803) now providing support.
The recent drop has pushed the price of BTC down below the 50-day Simple Moving Average (SMA), supporting the current bearish outlook, but still above its current support area.
Moreover, the Relative Strength Index (RSI) has been trading between 37 and 47, indicating continued indecision among investors.
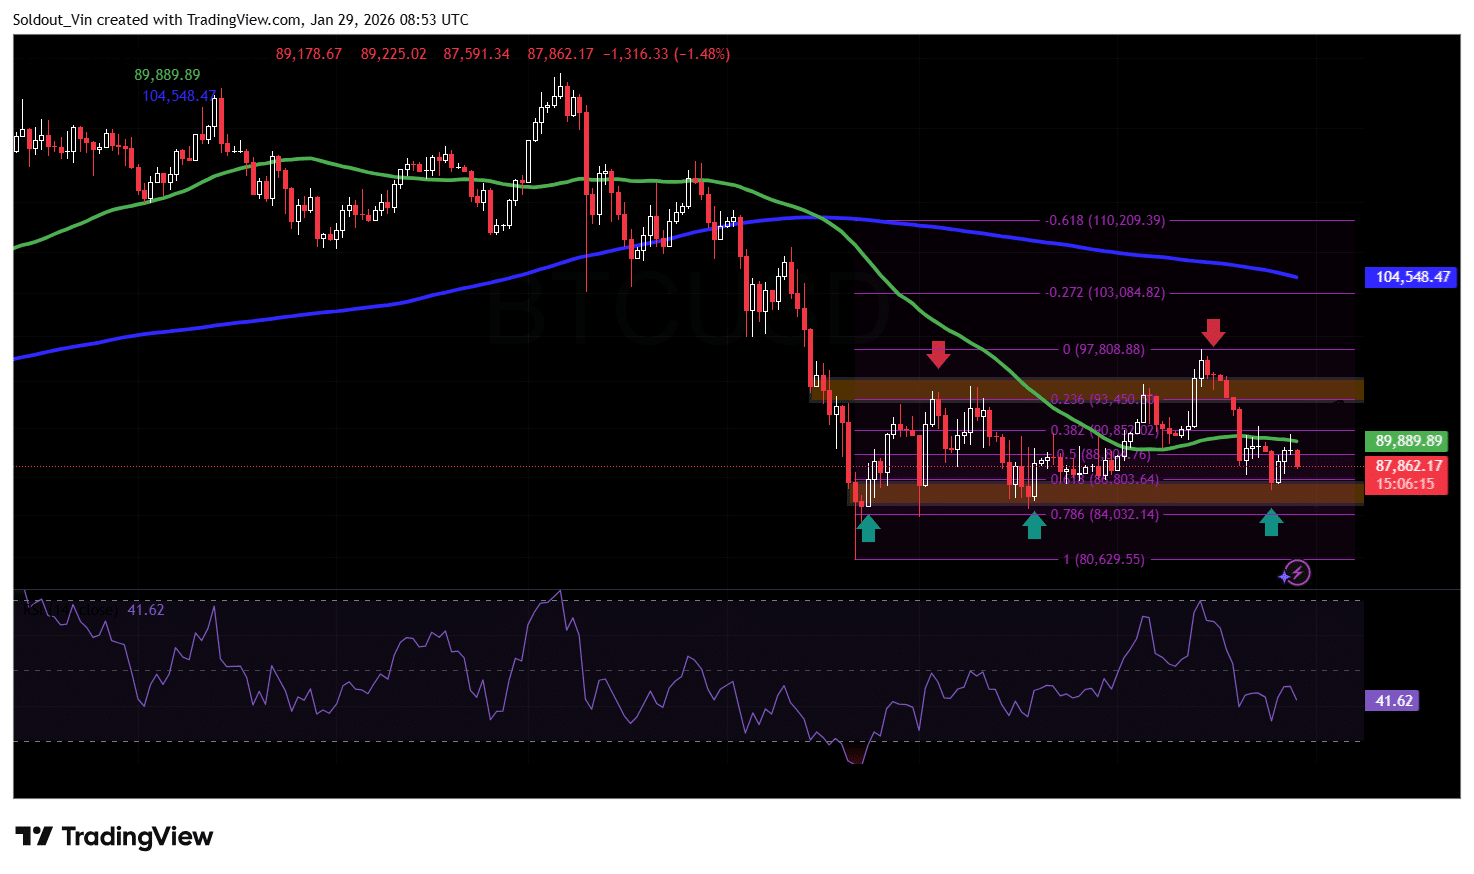 BTC/USD Chart Analysis Source: TradingView
BTC Price At A Critical Juncture
Bitcoin appears to be at a critical juncture, with price action consolidating within a range following a sharp corrective move.
The market is currently holding above a key demand area near the lower-range support, suggesting that buyers are still defending this zone despite the current bearish pressure. If BTC can stabilize above the 88,000–89,000 region and reclaim short-term resistance, a relief move toward the 93,000–95,000 area becomes increasingly likely as sellers lose momentum.
Conversely, failure to hold current support would weaken the consolidation structure and increase the probability of continuation toward lower support levels near the prior range lows.
In this case, if BTC drops below the 0.618 Fib level, the next possible support is at the 0.786 Fib level around $84,302, followed by the $80,629 level.
Related News:
You May Also Like

Bitcoin ETFs Surge with 20,685 BTC Inflows, Marking Strongest Week

XAG/USD retreats toward $113.00 on profit-taking pressure
