

XRP Price Signals Vulnerability With Another Drop On The Table
XRP price failed to surpass $1.950 and started another decline. The price is now correcting gains and might struggle to stay above $1.860.
- XRP price started a downside correction and declined below $1.90.
- The price is now trading below $1.890 and the 100-hourly Simple Moving Average.
- There was a break below a key bullish trend line with support at $1.910 on the hourly chart of the XRP/USD pair (data source from Kraken).
- The pair could start another increase if it stays above $1.860.
XRP Price Dips Further
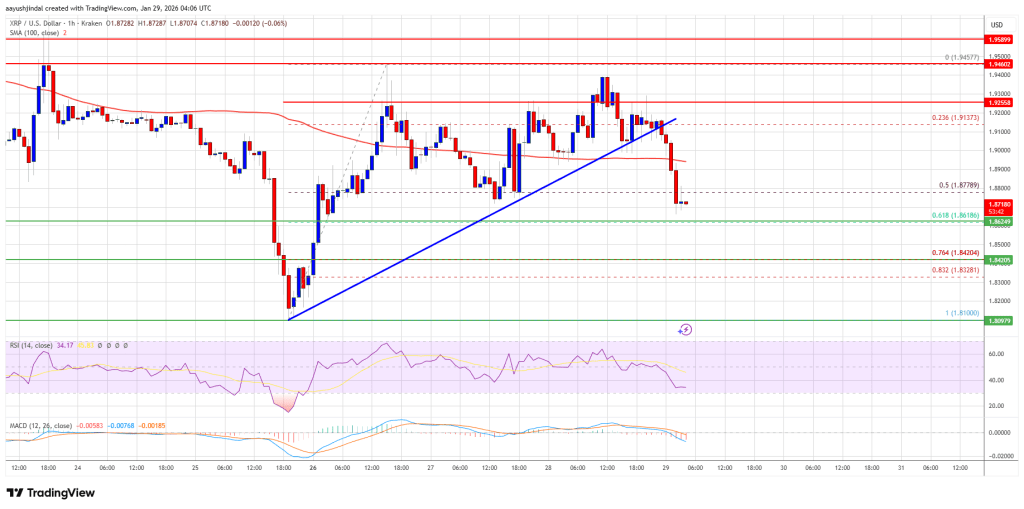
XRP price failed to clear $1.950 and started a downside correction, like Bitcoin and Ethereum. The price dipped below the $1.90 and $1.880 levels to enter a negative zone.
The price even dipped below the 50% Fib retracement level of the upward move from the $1.810 swing low to the $1.945 high. Besides, there was a break below a key bullish trend line with support at $1.910 on the hourly chart of the XRP/USD pair.
The price is now trading below $1.880 and the 100-hourly Simple Moving Average. If there is a fresh upward move, the price might face resistance near the $1.90 level. The first major resistance is near the $1.9250 level, above which the price could rise and test $1.950.
A clear move above the $1.950 resistance might send the price toward the $2.00 resistance. Any more gains might send the price toward the $2.00 resistance. The next major hurdle for the bulls might be near $2.050.
More Losses?
If XRP fails to clear the $1.9250 resistance zone, it could start a fresh decline. Initial support on the downside is near the $1.860 level and the 61.8% Fib retracement level of the upward move from the $1.810 swing low to the $1.945 high. The next major support is near the $1.8420 level.
If there is a downside break and a close below the $1.8420 level, the price might continue to decline toward $1.820. The next major support sits near the $1.80 zone, below which the price could continue lower toward $1.7650.
Technical Indicators
Hourly MACD – The MACD for XRP/USD is now gaining pace in the bearish zone.
Hourly RSI (Relative Strength Index) – The RSI for XRP/USD is now below the 50 level.
Major Support Levels – $1.860 and $1.8420.
Major Resistance Levels – $1.9250 and $1.950.
You May Also Like

Markets await Fed’s first 2025 cut, experts bet “this bull market is not even close to over”

Gold continues to hit new highs. How to invest in gold in the crypto market?
