

Bitcoin Price Prediction As Trump Threatens 25% Tariff Hike On South Korea
Bitcoin edged slightly higher on Tuesday, but still remains rangebound below the $90,000 mark, now hovering not far from its one-month lows, as traders remained cautious after Trump threatened a 25% tariff hike on South Korea and ahead of the Federal Reserve’s policy meeting.
BTC price edged up a fraction of a percentage over the last 24 hours to trade at $88,269 as of 03:18, as it continues to struggle to regain notable momentum after sharp losses last week and underperforms other assets.
The crypto market also saw a slight jump to a market capitalization of about $3.07 trillion.
Trade Tensions Spike as Trump Hits South Korea with 25% Tariffs
US President Donald Trump announced he is raising tariffs on South Korean imports to 25% after accusing the country of failing to live up to a trade deal reached last year.
Under the deal in October 2025, Seoul pledged $350 billion of investments into strategic US industries in return for tariffs being capped at 15%.
However, the government noted that “it is unlikely” that the investment could begin in the first half of this year, citing administrative reasons and currency market volatility.
In a social media post, Trump said he would increase levies on South Korean imports to 25% across various products, including automobiles, lumber, pharmaceuticals, and “all other Reciprocal TARIFFS.”
According to Trump, South Korean lawmakers have been slow to approve the deal, while the US has acted swiftly to reduce its tariffs in line with the transaction agreed to.
After Trump threatened to impose 100% tariffs on Canada over the weekend, and now South Korea, traders remain cautious, driving safe-haven assets like gold and silver to all-time highs.
Traders Watching The Federal Reserve Decision
To add to the market’s indecision, focus has shifted to the Federal Reserve’s two-day meeting, which begins today, January 27, and ends on January 28. Economists are widely expecting the policymakers to keep interest rates unchanged on Wednesday.
Traders are watching closely at the Fed’s statement and Chair Jerome Powell’s press conference for clues on the timing of potential rate cuts and the central bank’s inflation outlook.
Any shift in Powell’s tone could influence risk sentiment and liquidity conditions, both of which are key drivers of risk assets like Bitcoin.
With Bitcoin down 4.5% over the last 2 weeks, can it recover above $90,000?
Bitcoin Price Analysis: BTC Holds Strong Above Support
Bitcoin is currently trading within a well-defined consolidation range, in a sideways pattern, with the asset holding near the $86,500–$89,000 support zone after a sharp pullback from the late-2025 highs.
This area aligns with a previous demand zone in December, as BTC formed a strong support. BTC price now sits below the 50-day Simple Moving Average (SMA) ($90,025) and the 200-day SMA around $104,800, which continues to reflect the broader long-term uptrend.
Following a strong rally earlier in 2025, Bitcoin established a series of higher highs before momentum stalled near its all-time high around $126,000. This rejection led to a sustained price correction to around $80,500.
Since that drop, the price of BTC action has shifted into a range-bound structure, with buyers repeatedly stepping in near the $86,000 area, as highlighted by multiple downside rejections. This behavior suggests underlying demand is still in play, even as upside attempts continue to face resistance.
Each push toward the $93,000–$95,000 region has been met with selling, confirming this zone as an active supply area.
Momentum indicators echo this cautious tone. The daily RSI is currently hovering near 42, below the neutral 50 level. This shows reduced bullish momentum and a tilt toward seller control, though RSI is not yet in deeply oversold territory.
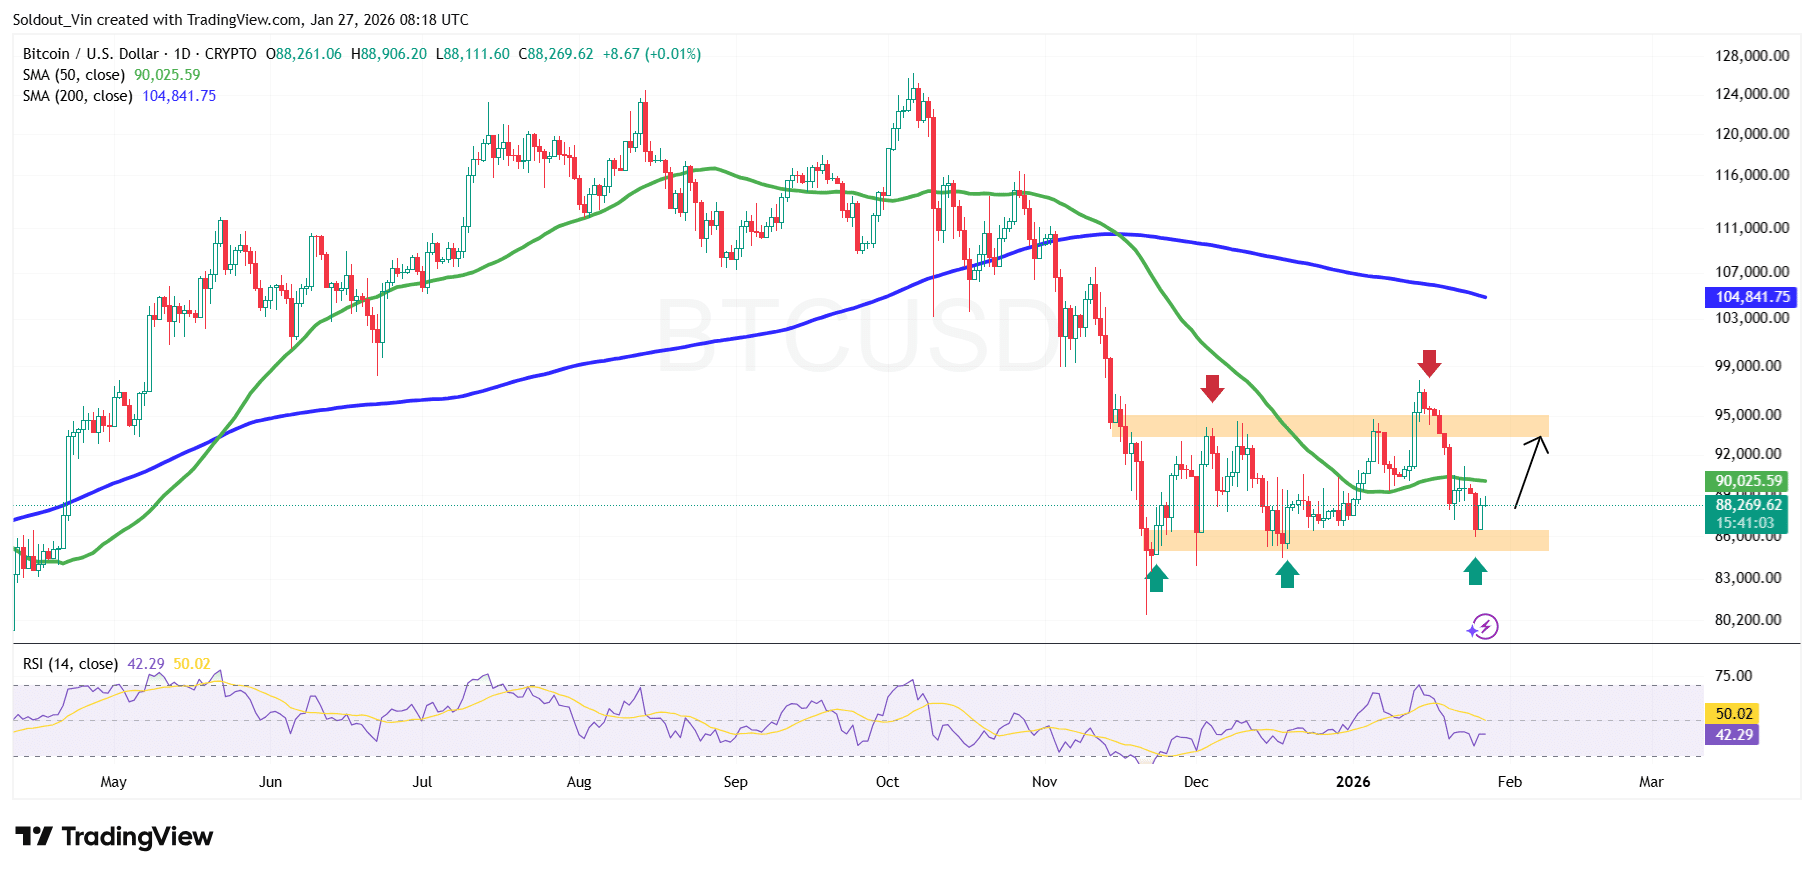 BTC/USD Chart Analysis Source: TradingView
BTC Price Prediction: $90,000 in Sight
From a technical view, the Bitcoin price is approaching a decision zone. Holding above the $86,000–$88,000 support region could allow BTC price to stabilize and attempt another push toward the $93,000–$95,000 resistance zone.
A sustained daily close back above the 50-day SMA would improve the bullish narrative and increase the probability of a recovery toward the $100,000–$104,000 area, near the 200-day SMA and prior breakout levels.
On the downside, a confirmed breakdown below the current support range around the $86,000 area would invalidate any bullish attempts. In this scenario, the next likely support zone and a cushion against downward pressure could be the $84,475 level, which has previously acted as a demand area.
Related News:
You May Also Like

Bitcoin ETFs Surge with 20,685 BTC Inflows, Marking Strongest Week

XAG/USD retreats toward $113.00 on profit-taking pressure
