Elite Crypto Trades Updates His Kaspa (KAS) Price Prediction
Javon Marks does not post about Kaspa often. The analyst, known for detailed chart setups on larger cap coins, usually sticks to Bitcoin, or XRP. But this time, he turned his attention to Kaspa, a project with a loyal and vocal community. That alone makes this update worth a closer look.
Marks shared a long-term Kaspa chart showing a clear falling wedge pattern. Price action has been compressing inside two downward sloping lines since the highs in 2024. The wedge is wide, spanning over a year of price action. Based on Marks’ analysis, Kaspa just broke out of that wedge to the upside.
His target sits near $0.09. From the current price around $0.031, that is almost 200 percent higher.
Kaspa Chart Breakdown
The TradingView chart Marks posted shows KASUSD on a multi-year timeframe. The falling wedge started after the 2024 peak. Each successive high got lower. Each low got lower too, but the range narrowed. That is the wedge tightening.
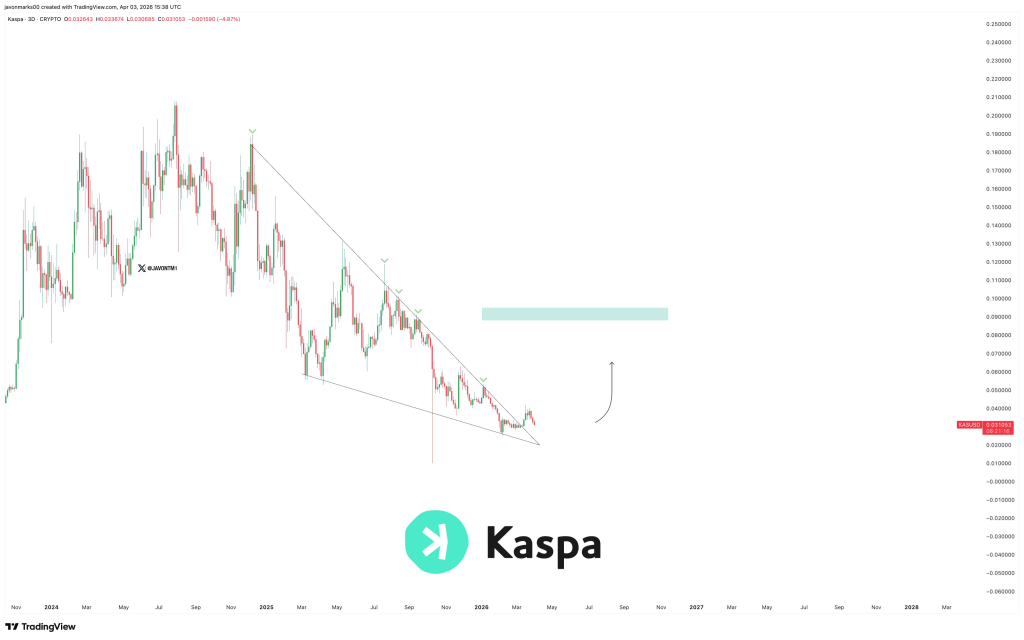 Source: X/@JavonTM1
The breakout candle appears to have closed above the upper trendline. Volume is not visible in the still image, but the break looks clean on the chart. The target of $0.09 is derived from measuring the widest part of the wedge and adding it to the breakout point. That is standard wedge math.
Marks does not call for a straight line to $0.09. He says this could be the early stages of a major reversal. That means the breakout needs confirmation. A return to the wedge high or a retest of the broken trendline would be normal before any real move higher.
Read also: Kaspa’s BTC Ratio Near Multi-Month Lows: What Traders Are Watching
Could Kaspa Really Make This Move?
Kaspa has a strong following. The community believes in the blockDAG technology and the fair launch narrative. But price action has been brutal. The KAS price lost more than 70 percent from its highs against the dollar and bled even harder against Bitcoin.
A falling wedge breakout on a multi-year chart is a classic reversal signal. If Marks is right, the worst may be behind for Kaspa holders. The $0.09 target is still far away, but the first step is breaking out. That step just happened.
Traders should watch for a weekly close above the wedge to confirm. If price holds, the path toward $0.05 and then $0.09 opens up. If the breakout fails and KAS falls back inside the wedge, the setup is dead. For now, one of crypto’s sharper chart readers just put Kaspa on the radar again after months (not to say years) or pretty sluggish price action.
Subscribe to our YouTube channel for daily crypto updates, market insights, and expert analysis.
The post Elite Crypto Trades Updates His Kaspa (KAS) Price Prediction appeared first on CaptainAltcoin.


You May Also Like

Trump Drops $1.5 Trillion FY2027 Pentagon Budget Request

HypurrFi Users Advised to Halt Activities Amid Domain Breach Investigation